
Page 845 - Read Online
P. 845
Oliveira et al. Hepatoma Res 2020;6:xx I http://dx.doi.org/10.20517/2394-5079.2020.73 Page 9 of 13
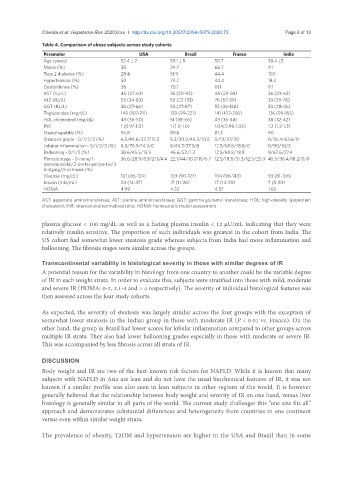
Table 4. Comparison of obese subjects across study cohorts
Parameter USA Brazil France India
Age (years) 52.4 ± 2 55.1 ± 5 50.7 38.4 ±5
Males (%) 38 24.7 66.7 9.1
Type 2 diabetes (%) 28.4 51.9 44.4 100
Hypertension (%) 50 79.2 44.4 18.2
Dyslipidemia (%) 38 70.1 61.1 9.1
AST (IU/L) 40 (27-63) 35 (20-93) 48 (29-58) 36 (23-62)
ALT (IU/L) 53 (34-83) 52 (22-101) 76 (57-99) 33 (29-78)
GGT (IU/L) 38 (27-66) 53 (27-87) 55 (36-128) 33 (28-46)
Triglycerides (mg/dL) 149 (107-211) 129 (99-221) 141 (107-256) 126 (99-155)
HDL cholesterol (mg/dL) 43 (36-50) 51 (38-66) 43 (36-48) 38 (32-42)
INR 1 (0.97-1.0) 1 (1.0-1.0) 1.04(0.96-1.06) 1.3 (1.2-1.3)
Steatohepatitis (%) 56.8 89.6 81.3 90
Steatosis grade - 0/1/2/3 (%) 6.5/44.6/33.7/15.2 5.3/20.0/45.3/10.8 0/13/57/30 0/36.4/63.6/0
Lobular inflammation - 0/1/2/3 (%) 8.8/76.9/14.3/0 8/46.7/37.3/8 12.5/68.8/18.8/0 0/90/10/0
Ballooning - 0/1/2 (%) 38.6/45.5/15.9 46.6/52/1.3 12.5/68.8/18.8 9/63.6/27.4
Fibrosis stage - 0-none/1- 36.6/28.9/8.9/21.1/4.4 22.7/44/10.7/16/6.7 12.5/18.8/31.3/12.5/25.0 45.5/36.4/18.2/0/0
perisinusoidal/2-portal-periportal/3-
bridging/4-cirrhosis (%)
Glucose (mg/dL) 101 (86-124) 103 (90-127) 104 (96-143) 93 (81-106)
Insulin (mU/mL) 20 (14-37) 17 (11-26) 17 (14-20) 7 (5-20)
HOMA 4.99 4.32 4.37 1.65
AST: aspartate aminotransferase; ALT: alanine aminotransferase; GGT: gamma glutamyl transferase; HDL: high-density lipoprotein
cholesterol; INR: international normalized ratio; HOMA: homeostatic model assessment
plasma glucose < 100 mg/dL as well as a fasting plasma insulin < 12 µU/mL indicating that they were
relatively insulin sensitive. The proportion of such individuals was greatest in the cohort from India. The
US cohort had somewhat lower steatosis grade whereas subjects from India had more inflammation and
ballooning. The fibrosis stages were similar across the groups.
Transcontinental variability in histological severity in those with similar degrees of IR
A potential reason for the variability in histology from one country to another could be the variable degree
of IR in each weight strata. In order to evaluate this, subjects were stratified into those with mild, moderate
and severe IR (HOMA: 0-2, 2.1-4 and > 4 respectively). The severity of individual histological features was
then assessed across the four study cohorts.
As expected, the severity of steatosis was largely similar across the four groups with the exception of
somewhat lower steatosis in the Indian group in those with moderate IR (P < 0.01 vs. France). On the
other hand, the group in Brazil had lower scores for lobular inflammation compared to other groups across
multiple IR strata. They also had lower ballooning grades especially in those with moderate or severe IR.
This was accompanied by less fibrosis across all strata of IR.
DISCUSSION
Body weight and IR are two of the best-known risk factors for NAFLD. While it is known that many
subjects with NAFLD in Asia are lean and do not have the usual biochemical features of IR, it was not
known if a similar profile was also seen in lean subjects in other regions of the world. It is however
generally believed that the relationship between body weight and severity of IR on one hand, versus liver
histology is generally similar in all parts of the world. The current study challenges this “one size fits all”
approach and demonstrates substantial differences and heterogeneity from countries in one continent
versus even within similar weight strata.
The prevalence of obesity, T2DM and hypertension are higher in the USA and Brazil than in some