
Page 844 - Read Online
P. 844
Page 8 of 13 Oliveira et al. Hepatoma Res 2020;6:xx I http://dx.doi.org/10.20517/2394-5079.2020.73
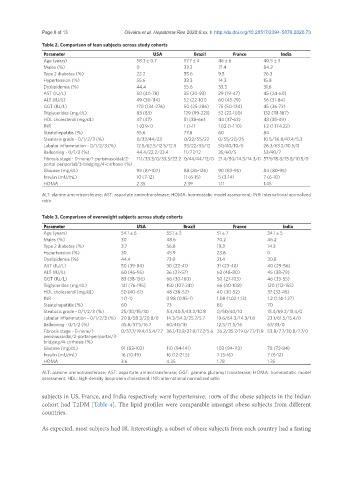
Table 2. Comparison of lean subjects across study cohorts
Parameter USA Brazil France India
Age (years) 58.3 ± 0.7 57.7 ± 4 46 ± 6 40.5 ± 3
Males (%) 0 33.3 71.4 84.2
Type 2 diabetes (%) 22.2 55.6 9.5 26.3
Hypertension (%) 55.6 33.3 14.3 15.8
Dyslipidemia (%) 44.4 55.6 33.3 31.6
AST (IU/L) 50 (40-78) 35 (20-93) 29 (19-47) 45 (24-60)
ALT (IU/L) 49 (30-114) 52 (22-101) 60 (45-79) 56 (31-84)
GGT (IU/L) 170 (134-276) 50 (25-286) 75 (50-134) 45 (36-72)
Triglycerides (mg/dL) 83 (83) 129 (99-221) 52 (22-100) 132 (111-187)
HDL cholesterol (mg/dL) 47 (47) 51 (38-66) 44 (37-63) 43 (35-49)
INR 1 (0.9-1) 1 (1-1) 1.03 (1-1.10) 1.2 (1.17-1.22)
Steatohepatitis (%) 55.6 77.8 60 84
Steatosis grade - 0/1/2/3 (%) 0/33/44/23 0/22/55/22 0/55/20/25 10.5/36.8/47.4/5.3
Lobular inflammation - 0/1/2/3 (%) 12.5/62.5/12.5/12.5 33/22/33/12 50/40/10/0 26.3/63.2/10.5/0
Ballooning - 0/1/2 (%) 44.4/22.2/33.4 11/77/12 35/60/5 53/40/7
Fibrosis stage - 0-none/1-perisinusoidal/2- 11.1/33.3/0/33.3/22.2 0/44/44/12/0 21.4/50/14.3/14.3/0 57.9/15.8/15.8/10.5/0
portal-periportal/3-bridging/4-cirrhosis (%)
Glucose (mg/dL) 95 (87-107) 88 (85-126) 90 (83-95) 84 (80-95)
Insulin (mU/mL) 10 (7-12) 11 (6-15) 5 (3-14) 7 (6-10)
HOMA 2.35 2.39 1.11 1.45
ALT: alanine aminotransferase; AST: aspartate aminotransferase; HOMA: homeostatic model assessment; INR: international normalized
ratio
Table 3. Comparison of overweight subjects across study cohorts
Parameter USA Brazil France India
Age (years) 54.1 ± 6 55.1 ± 2 51 ± 7 34.1 ± 5
Males (%) 30 48.6 70.2 46.2
Type 2 diabetes (%) 3.7 56.8 19.3 14.3
Hypertension (%) 30 45.9 23.6 0
Dyslipidemia (%) 44.4 73.0 21.4 30.8
AST (IU/L) 50 (39-84) 30 (22-41) 31 (23-48) 40 (29-56)
ALT (IU/L) 60 (46-95) 36 (27-57) 63 (48-80) 45 (38-79)
GGT (IU/L) 83 (38-156) 66 (30-160) 50 (27-103) 46 (33-55)
Triglycerides (mg/dL) 141 (76-195) 150 (107-241) 66 (40-108) 120 (112-155)
HDL cholesterol (mg/dL) 50 (40-61) 48 (38-52) 40 (30-52) 37 (32-45)
INR 1 (1-1) 0.98 (0.95-1) 1.08 (1.02-1.13) 1.2 (1.14-1.27)
Steatohepatitis (%) 60 73 80 70
Steatosis grade - 0/1/2/3 (%) 25/30/15/30 5.4/40.5/43.2/10.8 0/50/40/10 15.4/69.2/15.4/0
Lobular inflammation - 0/1/2/3 (%) 20.8/58.3/20.8/0 14.3/54.3/25.7/5.7 19.6/64.3/14.3/1.8 23.1/61.5/15.4/0
Ballooning - 0/1/2 (%) 45.8/37.5/16.7 60/40/10 12.5/71.5/16 67/33/0
Fibrosis stage - 0-none/1- 0/57.7/19.4/15.4/7.7 36.1/13.9/27.8/17.7/5.6 26.2/35.7/19.0/7.1/11.9 53.8/7.7/30.8/7.7/0
perisinusoidal/2-portal-periportal/3-
bridging/4-cirrhosis (%)
Glucose (mg/dL) 91 (83-102) 110 (94-141) 103 (94-113) 78 (72-84)
Insulin (mU/mL) 16 (10-19) 16 (12-21.5) 7 (5-16) 7 (6-12)
HOMA 3.6 4.35 1.78 1.35
ALT: alanine aminotransferase; AST: aspartate aminotransferase; GGT: gamma glutamyl transferase; HOMA: homeostatic model
assessment; HDL: high-density lipoprotein cholesterol; INR: international normalized ratio
subjects in US, France, and India respectively were hypertensive. 100% of the obese subjects in the Indian
cohort had T2DM [Table 4]. The lipid profiles were comparable amongst obese subjects from different
countries.
As expected, most subjects had IR. Interestingly, a subset of obese subjects from each country had a fasting