
Page 841 - Read Online
P. 841
Oliveira et al. Hepatoma Res 2020;6:xx I http://dx.doi.org/10.20517/2394-5079.2020.73 Page 5 of 13
A B
C D
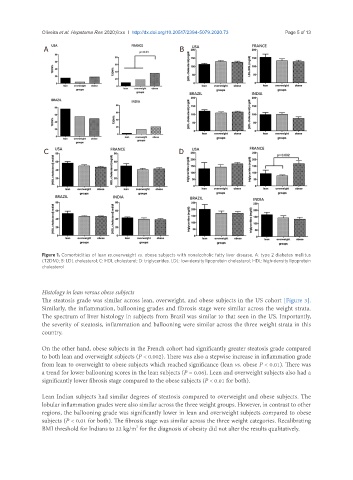
Figure 1. Comorbidities of lean vs.overweight vs. obese subjects with nonalcoholic fatty liver disease. A: type 2 diabetes mellitus
(T2DM); B: LDL cholesterol; C: HDL cholesterol; D: triglycerides. LDL: low-density lipoprotein cholesterol; HDL: high-density lipoprotein
cholesterol
Histology in lean versus obese subjects
The steatosis grade was similar across lean, overweight, and obese subjects in the US cohort [Figure 3].
Similarly, the inflammation, ballooning grades and fibrosis stage were similar across the weight strata.
The spectrum of liver histology in subjects from Brazil was similar to that seen in the US. Importantly,
the severity of steatosis, inflammation and ballooning were similar across the three weight strata in this
country.
On the other hand, obese subjects in the French cohort had significantly greater steatosis grade compared
to both lean and overweight subjects (P < 0.002). There was also a stepwise increase in inflammation grade
from lean to overweight to obese subjects which reached significance (lean vs. obese P < 0.01). There was
a trend for lower ballooning scores in the lean subjects (P = 0.06). Lean and overweight subjects also had a
significantly lower fibrosis stage compared to the obese subjects (P < 0.01 for both).
Lean Indian subjects had similar degrees of steatosis compared to overweight and obese subjects. The
lobular inflammation grades were also similar across the three weight groups. However, in contrast to other
regions, the ballooning grade was significantly lower in lean and overweight subjects compared to obese
subjects (P < 0.01 for both). The fibrosis stage was similar across the three weight categories. Recalibrating
2
BMI threshold for Indians to 22 kg/m for the diagnosis of obesity did not alter the results qualitatively.