
Page 840 - Read Online
P. 840
Page 4 of 13 Oliveira et al. Hepatoma Res 2020;6:xx I http://dx.doi.org/10.20517/2394-5079.2020.73
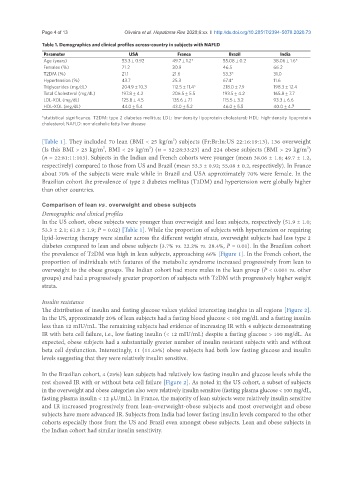
Table 1. Demographics and clinical profiles across-country in subjects with NAFLD
Parameter USA France Brazil India
Age (years) 53.3 ± 0.92 49.7 ± 1.2* 55.08 ± 0.2 38.06 ± 1.6*
Females (%) 71.2 30.9 46.5 66.2
T2DM (%) 21.1 21.6 53.3* 31.0
Hypertension (%) 43.7 25.3 67.4* 11.6
Triglycerides (mg/dL) 204.9 ± 10.3 112.5 ± 11.4* 218.0 ± 7.9 198.3 ± 12.4
Total Cholesterol (mg/dL) 197.8 ± 4.2 206.5 ± 5.5 193.5 ± 4.2 165.8 ± 7.7
LDL-XOL (mg/dL) 125.8 ± 4.5 135.6 ± 7.1 115.5 ± 3.2 93.3 ± 6.6
HDL-XOL (mg/dL) 44.0 ± 5.4 43.0 ± 5.2 46.0 ± 5.5 40.0 ± 4.7
*statistical significance. T2DM: type 2 diabetes mellitus; LDL: low-density lipoprotein cholesterol; HDL: high-density lipoprotein
cholesterol; NAFLD: non-alcoholic fatty liver disease
2
[Table 1]. They included 70 lean (BMI < 25 kg/m ) subjects (Fr:Br:In:US 22:16:19:13), 136 overweight
2
2
2
(Is this BMI > 25 kg/m , BMI < 29 kg/m ) (n = 52:28:33:23) and 224 obese subjects (BMI > 29 kg/m )
(n = 22:81:11:103). Subjects in the Indian and French cohorts were younger (mean 38.06 ± 1.6; 49.7 ± 1.2,
respectively) compared to those from US and Brazil (mean 53.3 ± 0.92; 55.08 ± 0.2, respectively). In France
about 70% of the subjects were male while in Brazil and USA approximately 70% were female. In the
Brazilian cohort the prevalence of type 2 diabetes mellitus (T2DM) and hypertension were globally higher
than other countries.
Comparison of lean vs . overweight and obese subjects
Demographic and clinical profiles
In the US cohort, obese subjects were younger than overweight and lean subjects, respectively (51.9 ± 1.0;
53.3 ± 2.1; 61.8 ± 1.9; P = 0.02) [Table 1]. While the proportion of subjects with hypertension or requiring
lipid-lowering therapy were similar across the different weight strata, overweight subjects had less type 2
diabetes compared to lean and obese subjects (3.7% vs. 22.2% vs. 28.4%, P = 0.01). In the Brazilian cohort
the prevalence of T2DM was high in lean subjects, approaching 66% [Figure 1]. In the French cohort, the
proportion of individuals with features of the metabolic syndrome increased progressively from lean to
overweight to the obese groups. The Indian cohort had more males in the lean group (P < 0.001 vs. other
groups) and had a progressively greater proportion of subjects with T2DM with progressively higher weight
strata.
Insulin resistance
The distribution of insulin and fasting glucose values yielded interesting insights in all regions [Figure 2].
In the US, approximately 20% of lean subjects had a fasting blood glucose < 100 mg/dL and a fasting insulin
less than 12 mIU/mL. The remaining subjects had evidence of increasing IR with 4 subjects demonstrating
IR with beta cell failure, i.e., low fasting insulin (< 12 mIU/mL) despite a fasting glucose > 100 mg/dL. As
expected, obese subjects had a substantially greater number of insulin resistant subjects with and without
beta cell dysfunction. Interestingly, 11 (11.45%) obese subjects had both low fasting glucose and insulin
levels suggesting that they were relatively insulin sensitive.
In the Brazilian cohort, 4 (25%) lean subjects had relatively low fasting insulin and glucose levels while the
rest showed IR with or without beta cell failure [Figure 2]. As noted in the US cohort, a subset of subjects
in the overweight and obese categories also were relatively insulin sensitive (fasting plasma glucose < 100 mg/dL,
fasting plasma insulin < 12 µU/mL). In France, the majority of lean subjects were relatively insulin sensitive
and IR increased progressively from lean-overweight-obese subjects and most overweight and obese
subjects have more advanced IR. Subjects from India had lower fasting insulin levels compared to the other
cohorts especially those from the US and Brazil even amongst obese subjects. Lean and obese subjects in
the Indian cohort had similar insulin sensitivity.