
Page 768 - Read Online
P. 768
Page 6 of 10 Shimizuguchi et al. Hepatoma Res 2020;6:66 I http://dx.doi.org/10.20517/2394-5079.2020.51
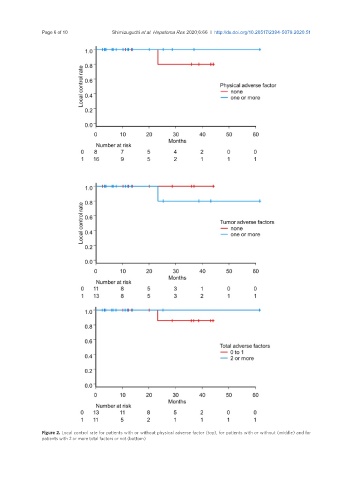
Figure 2. Local control rate for patients with or without physical adverse factor (top), for patients with or without (middle) and for
patients with 2 or more total factors or not (bottom)