
Page 146 - Read Online
P. 146
Tsutsui et al. Hepatoma Res 2018;4:13 I http://dx.doi.org/10.20517/2394-5079.2018.20 Page 7 of 11
Table 5. Postoperative liver function: treatment group versus control group
1 POD 3 POD 7 POD 1 POM
Treatment Control Treatment Control Treatment Control Treatment Control
group group P group group P group group P group group P
(n = 13) (n =36) (n = 13) (n = 36) (n = 13) (n = 36) (n = 13) (n = 36)
Total 1.77 ± 0.96 1.69 ± 0.89 0.801 1.40 ± 0.70 1.44 ± 0.78 0.867 0.90 ± 0.26 0.87 ± 0.34 0.770 0.65 ± 0.28 0.68 ± 0.30 0.594
bilirubin
(mg/dL)
Serum 3.65 ± 0.29 3.50 ± 0.37 0.206 3.61 ± 0.29 3.35 ± 0.45 0.069 3.40 ± 0.25 3.15 ± 0.40 0.057 3.86 ± 0.46 3.69 ± 0.39 0.227
albumin
(g/dL)
Serum AST 220 ± 161 254 ± 168 0.534 71.2 ± 55.7 84.1 ± 35.0 0.339 41.5 ± 29.0 36.1 ± 14.3 0.526 28.6 ± 8.27 46.0 ± 22.4 0.008
(U/L)
Serum ALT 147 ± 117 193 ± 143 0.303 94.4 ± 66.2 118.7 ± 73.6 0.300 55.8 ± 48.1 55.0 ± 30.7 0.940 22.0 ± 8.50 40.1 ± 21.5 0.004
(U/L)
Prothrombin 69.5 ± 20.4 65.5 ± 10.9 0.505 81.4 ± 9.35 77.6 ± 13.4 0.357 80.5 ± 9.9 94.7 ± 118.7 0.671 84.7 ± 9.57 76.3 ± 14.5 0.079
time (%)
Platelet 11.6 ± 3.50 11.8 ± 3.17 0.843 5.76 ± 1.60 12.1 ± 3.38 0.223 18.7 ± 9.85 15.7 ± 4.78 0.312 18.5 ± 5.27 15.3 ± 4.80 0.056
(× 10 /μL)
4
C-reactive - - - - 2.23 ± 1.68 2.48 ± 2.05 0.709 0.75 ± 1.82 0.41 ± 0.63 0.329
protein
(mg/dL)
AST: aspartate aminotransferase; ALT: alanine aminotransferase; AFP: alpha-fetoprotein; POD: post-operative day; POM: post-operative
month
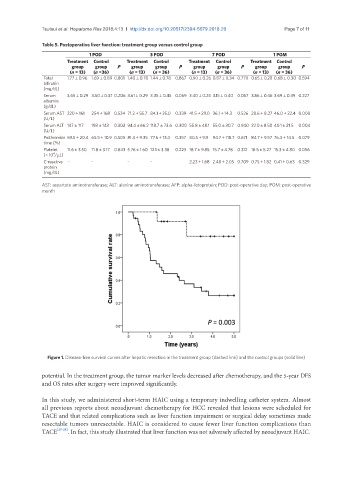
Figure 1. Disease-free survival curves after hepatic resection in the treatment group (dashed line) and the control groups (solid line)
potential. In the treatment group, the tumor marker levels decreased after chemotherapy, and the 5-year DFS
and OS rates after surgery were improved significantly.
In this study, we administered short-term HAIC using a temporary indwelling catheter system. Almost
all previous reports about neoadjuvant chemotherapy for HCC revealed that lesions were scheduled for
TACE and that related complications such as liver function impairment or surgical delay sometimes made
resectable tumors unresectable. HAIC is considered to cause fewer liver function complications than
TACE [25-28] . In fact, this study illustrated that liver function was not adversely affected by neoadjuvant HAIC.