
Page 145 - Read Online
P. 145
Page 6 of 11 Tsutsui et al. Hepatoma Res 2018;4:13 I http://dx.doi.org/10.20517/2394-5079.2018.20
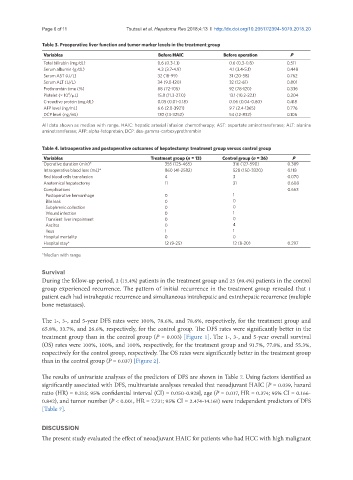
Table 3. Preoperative liver function and tumor marker levels in the treatment group
Variables Before HAIC Before operation P
Total bilirubin (mg/dL) 0.6 (0.3-1.1) 0.6 (0.3-0.8) 0.511
Serum albumin (g/dL) 4.3 (3.7-4.9) 4.1 (3.4-5.1) 0.448
Serum AST (U/L) 32 (18-99) 31 (20-58) 0.762
Serum ALT (U/L) 34 (9.0-120) 32 (12-61) 0.801
Prothrombin time (%) 88 (72-105) 92 (78-120) 0.336
4
Platelet (× 10 /μL) 15.8 (11.3-27.0) 13.1 (10.2-22.1) 0.204
C-reactive protein (mg/dL) 0.05 (0.01-0.18) 0.06 (0.04-0.60) 0.418
AFP level (ng/mL) 6.6 (2.0-3921) 9.7 (2.4-1365) 0.776
DCP level (ng/mL) 130 (13-3252) 54 (12-832) 0.106
All data shown as median with range. HAIC: hepatic arterial infusion chemotherapy; AST: aspartate aminotransferase; ALT: alanine
aminotransferase; AFP: alpha-fetoprotein; DCP: des-gamma-carboxyprothrombin
Table 4. Intraoperative and postoperative outcomes of hepatectomy: treatment group versus control group
Variables Treatment group (n = 13) Control group (n = 36) P
Operative duration (min)* 355 (125-465) 316 (127-590) 0.389
Intraoperative blood loss (mL)* 860 (41-2582) 528 (150-3320) 0.118
Red blood cells transfusion 4 3 0.070
Anatomical hepatectomy 11 31 0.608
Complications 0.663
Postoperative hemorrhage 0 1
Bile leak 0 0
Subphrenic collection 0 0
Wound infection 0 1
Transient liver impairment 0 0
Ascites 0 4
Ileus 1 1
Hospital mortality 0 0
Hospital stay* 12 (9-25) 12 (8-20) 0.297
*Median with range
Survival
During the follow-up period, 2 (15.4%) patients in the treatment group and 25 (69.4%) patients in the control
group experienced recurrence. The pattern of initial recurrence in the treatment group revealed that 1
patient each had intrahepatic recurrence and simultaneous intrahepatic and extrahepatic recurrence (multiple
bone metastases).
The 1-, 3-, and 5-year DFS rates were 100%, 78.6%, and 78.6%, respectively, for the treatment group and
65.8%, 33.7%, and 26.6%, respectively, for the control group. The DFS rates were significantly better in the
treatment group than in the control group (P = 0.003) [Figure 1]. The 1-, 3-, and 5-year overall survival
(OS) rates were 100%, 100%, and 100%, respectively, for the treatment group and 91.7%, 77.8%, and 55.3%,
respectively for the control group, respectively. The OS rates were significantly better in the treatment group
than in the control group (P = 0.037) [Figure 2].
The results of univariate analyses of the predictors of DFS are shown in Table 7. Using factors identified as
significantly associated with DFS, multivariate analyses revealed that neoadjuvant HAIC [P = 0.039, hazard
ratio (HR) = 0.215; 95% confidential interval (CI) = 0.050-0.928], age (P = 0.017, HR = 0.374; 95% CI = 0.166-
0.842), and tumor number (P < 0.001, HR = 7.731; 95% CI = 2.474-14.161) were independent predictors of DFS
[Table 7].
DISCUSSION
The present study evaluated the effect of neoadjuvant HAIC for patients who had HCC with high malignant