
Page 270 - Read Online
P. 270
Lecchini et al. HCC vascular invasion in sorafenib treatment
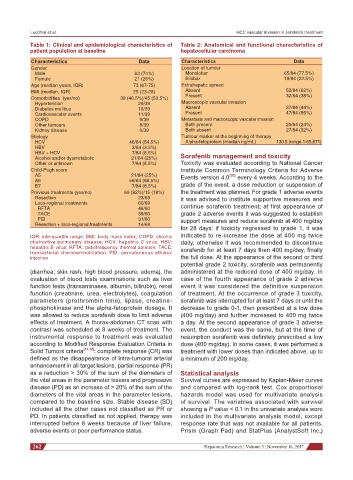
Table 1: Clinical and epidemiological characteristics of Table 2: Anatomical and functional characteristics of
patient population at baseline hepatocellular carcinoma
Characteristics Data Characteristics Data
Gender Location of tumour
Male 63 (74%) Monolobar 65/84 (77.5%)
Female 21 (26%) Bilobar 19/84 (22.5%)
Age (median years, IQR) 73 (67-75) Extrahepatic spread
BMI (median, IQR) 25 (23-28) Absent 52/84 (62%)
Comorbidities (yes/no) 39 (46.5%)/45 (53.5%) Present 32/84 (38%)
Hypertension 29/39 Macroscopic vascular invasion
Diabetes mellitus 16/39 Absent 37/84 (44%)
Cardiovascular events 11/39 Present 47/84 (56%)
COPD 9/39 Metastasis and macroscopic vascular invasion
Other tumours 8/39 Both present 20/84 (24%)
Kidney disease 0/39 Both absent 27/84 (32%)
Etiology Tumour marker at the beginning of therapy
HCV 46/84 (54.5%) Alpha-fetoprotein (median ng/mL) 130.5 (range 1-65,671)
HBV 3/84 (3.5%)
HBV + HCV 7/84 (8.5%)
Alcohol and/or dysmetabolic 21/84 (25%) Sorafenib management and toxicity
Other or unknown 7/84 (8.5%) Toxicity was evaluated according to National Cancer
Child-Pugh score Institute Common Terminology Criteria for Adverse
A5 21/84 (25%) Events version 4.0 [20] every 4 weeks. According to the
A6 56/84 (66.5%)
B7 7/84 (8.5%) grade of the event, a dose reduction or suspension of
Previous treatments (yes/no) 69 (82%)/15 (18%) the treatment was planned. For grade 1 adverse events
Resection 23/69 it was advised to institute supportive measures and
Loco-regional treatments 60/69
RFTA 46/60 continue sorafenib treatment; at first appearance of
TACE 39/60 grade 2 adverse events it was suggested to establish
PEI 31/60 support measures and reduce sorafenib at 400 mg/day
Resection + loco-regional treatments 14/69
for 28 days: if toxicity regressed to grade 1, it was
IQR: interquartile range; BMI: body mass index; COPD: chronic indicated to re-increase the dose at 400 mg twice
obstructive pulmonary disease; HCV: hepatitis C virus; HBV: daily, otherwise it was recommended to discontinue
hepatitis B virus; RFTA: radiofrequency thermal ablation; TACE: sorafenib for at least 7 days then 400 mg/day, finally
transarterial chemoembolization; PEI: percutaneous ethanol
injection the full dose. At the appearance of the second or third
potential grade 2 toxicity, sorafenib was permanently
(diarrhea, skin rash, high blood pressure, edema), the administered at the reduced dose of 400 mg/day. In
evaluation of blood tests examinations such as liver case of the fourth appearance of grade 2 adverse
function tests (transaminases, albumin, bilirubin), renal event it was considered the definitive suspension
function (creatinine, urea, electrolytes), coagulation of treatment. At the occurrence of grade 3 toxicity,
parameters (prothrombin time), lipase, creatine- sorafenib was interrupted for at least 7 days or until the
phosphokinase and the alpha-fetoprotein dosage. It decrease to grade 0-1, then prescribed at a low dose
was allowed to reduce sorafenib dose to limit adverse (400 mg/day) and further increased to 400 mg twice
effects of treatment. A thorax-abdomen CT scan with a day. At the second appearance of grade 3 adverse
contrast was scheduled at 8 weeks of treatment. The event, the conduct was the same, but at the time of
instrumental response to treatment was evaluated resumption sorafenib was definitely prescribed a low
according to Modified Response Evaluation Criteria in dose (400 mg/day). In some cases, it was performed a
Solid Tumors criteria [11,12] : complete response (CR) was treatment with lower doses than indicated above, up to
defined as the disappearance of intra-tumoral arterial a minimum of 200 mg/day.
enhancement in all target lesions, partial response (PR)
as a reduction > 30% of the sum of the diameters of Statistical analysis
the vital areas in the parameter lesions and progressive Survival curves are expressed by Kaplan-Meier curves
disease (PD) as an increase of > 20% of the sum of the and compared with log-rank test. Cox proportional
diameters of the vital areas in the parameter lesions, hazards model was used for multivariate analysis
compared to the baseline size. Stable disease (SD) of survival. The variables associated with survival
included all the other cases not classified as PR or showing a P value < 0.1 in the univariate analysis were
PD. In patients classified as not applied, therapy was included in the multivariate analysis model, except
interrupted before 8 weeks because of liver failure, response rate that was not available for all patients.
adverse events or poor performance status. Prism (Graph Pad) and StatPlus (AnalystSoft Inc.)
262 Hepatoma Research ¦ Volume 3 ¦ November 16, 2017