
Page 48 - Read Online
P. 48
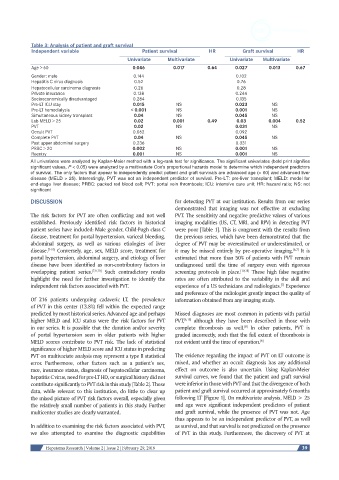
Table 3: Analysis of patient and graft survival
            Independent variable                   Patient survival       HR          Graft survival     HR
                                                Univariate            Multivariate     Univariate       Multivariate
            Age > 60                            0.046         0.017       0.64      0.027      0.013     0.67
            Gender: male                        0.144                               0.102
            Hepatitis C virus diagnosis         0.52                                0.76
            Hepatocellular carcinoma diagnosis  0.26                                0.28
            Private insurance                   0.138                               0.244
            Socioeconomically disadvantaged     0.284                               0.135
            Pre-LT ICU stay                     0.015          NS                   0.023       NS
            Pre-LT hemodialysis                < 0.001         NS                   0.001       NS
            Simultaneous kidney transplant      0.04           NS                   0.045       NS
            Lab MELD > 25                       0.02          0.001       0.49      0.03       0.004     0.52
            PVT                                 0.02           NS                   0.031       NS
            Occult PVT                          0.062                               0.092
            Complete PVT                        0.04           NS                   0.045       NS
            Past upper abdominal surgery        0.236                               0.331
            PRBC > 20                           0.002          NS                   0.001       NS
            Reentry                             0.001          NS                   0.001       NS
            All univariates were analyzed by Kaplan-Meier method with a log-rank test for significance. The significant univariates (bold print signifies
            significant values, P < 0.05) were analyzed by a multivariate Cox’s proportional hazards model to determine which independent predictors
            of survival. The only factors that appear to independently predict patient and graft survivals are advanced age (> 60) and advanced liver
            disease (MELD > 25). Interestingly, PVT was not an independent predictor of survival. Pre-LT: pre-liver transplant; MELD: model for
            end-stage liver disease; PRBC: packed red blood cell; PVT: portal vein thrombosis; ICU: intensive care unit; HR: hazard ratio; NS: not
            significant
            DISCUSSION                                         for detecting PVT at our institution. Results from our series
                                                               demonstrated that imaging was not effective at excluding
            The  risk factors for  PVT  are  often conflicting  and  not  well   PVT. The sensitivity and negative predictive values of various
            established. Previously identified risk factors in historical   imaging modalities (US, CT, MRI, and RPV) in detecting PVT
            patient series have included: Male gender, Child-Pugh class C   were poor [Table 1]. This is congruent with the results from
            disease, treatment for portal hypertension, variceal bleeding,   the previous series, which have been demonstrated that the
            abdominal surgery, as well as various etiologies of liver   degree of PVT may be overestimated or underestimated, or
            disease. [7-10]  Conversely, age, sex, MELD score, treatment for   it may be missed entirely by pre-operative imaging.  It is
                                                                                                        [6,7]
            portal hypertension, abdominal surgery, and etiology of liver   estimated that more than 50% of patients with PVT remain
            disease have been identified as non-contributory factors in   undiagnosed until the time of surgery even with rigorous
            overlapping patient series. [7,9,10]  Such contradictory results   screening  protocols  in  place. [10,11]   These  high  false  negative
            highlight the need for further investigation to identify the   rates are often attributed to the variability in the skill and
            independent risk factors associated with PVT.      experience of a US technicians and radiologists.  Experience
                                                                                                    [7]
                                                               and preference of the radiologist greatly impact the quality of
            Of  216  patients  undergoing  cadaveric  LT,  the  prevalence   information obtained from any imaging study.
            of PVT in this center (13.8%) fell within the expected range
            predicted by most historical series. Advanced age and perhaps   Missed diagnoses are most common in patients with partial
            higher MELD and ICU status were the risk factors for PVT   PVT, [6,15]  although they have been described in those with
            in our series. It is possible that the duration and/or severity   complete thrombosis as well.  In other patients, PVT is
                                                                                       [8]
            of portal hypertension seen in older patients with higher   graded incorrectly, such that the full extent of thrombosis is
            MELD scores contribute to PVT risk. The lack of statistical   not evident until the time of operation. [6]
            significance of higher MELD score and ICU status in predicting
            PVT on multivariate analysis may represent a type II statistical   The evidence regarding the impact of PVT on LT outcome is
            error. Furthermore, other factors such as a patient’s sex,   mixed, and whether an occult diagnosis has any additional
            race, insurance status, diagnosis of hepatocellular carcinoma,   effect on outcome is also uncertain. Using Kaplan-Meier
            hepatitis C virus, need for pre-LT HD, or surgical history did not   survival curves, we found that the patient and graft survival
            contribute significantly to PVT risk in this study [Table 2]. These   were inferior in those with PVT and that the divergence of both
            data, while relevant to this institution, do little to clear up   patient and graft survival occurred at approximately 6 months
            the mixed picture of PVT risk factors overall, especially given   following LT [Figure 1]. On multivariate analysis, MELD > 25
            the relatively small number of patients in this study. Further   and age were significant independent predictors of patient
            multicenter studies are clearly warranted.         and graft survival, while the presence of PVT was not. Age
                                                               thus appears to be an independent predictor of PVT, as well
            In addition to examining the risk factors associated with PVT,   as survival, and that survival is not predicated on the presence
            we also attempted to examine the diagnostic capabilities   of PVT in this study. Furthermore, the discovery of PVT at


                 Hepatoma Research | Volume 2 | Issue 2 | February 29, 2016                                39