
Page 47 - Read Online
P. 47
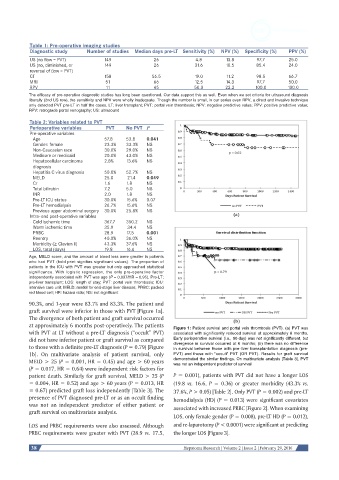
Table 1: Pre-operative imaging studies
           Diagnostic study      Number of studies  Median days pre-LT Sensitivity (%)  NPV (%)  Specificity (%)       PPV (%)
           US (no flow = PVT)         149              26             4.8       13.8       97.7       25.0
           US (no, diminished, or     149              26            31.6       10.5       85.4       24.0
           reversal of flow = PVT)
           CT                         158             56.5           19.0       11.2       98.5       66.7
           MRI                        51               66            12.5       14.3       97.7       50.0
           RPV                        11               45            50.0       22.2       100.0      100.0
           The efficacy of pre-operative diagnostic studies has long been questioned. Our data support this as well. Even when we set criteria for ultrasound diagnosis
           liberally (2nd US row), the sensitivity and NPV were wholly inadequate. Though the number is small, in our series even RPV, a direct and invasive technique
           only detected PVT pre-LT in half the cases. LT: liver transplant; PVT: portal vein thrombosis; NPV: negative predictive value; PPV: positive predictive value;
           RPV: retrograde portal venography; US: ultrasound
           Table 2: Variables related to PVT
           Perioperative variables     PVT   No PVT  P
           Pre-operative variables
             Age                      57.8   53.8    0.041
             Gender: female           23.3%  33.3%   NS
             Non-Caucasian race       30.0%   29.0%  NS
             Medicare or medicaid     20.0%  43.0%   NS
             Hepatocellular carcinoma   2.8%  13.6%  NS
             diagnosis
             Hepatitis C virus diagnosis  50.0%  52.7%  NS
             MELD                     25.0    21.4   0.049
             Cr                       1.6    1.8     NS
             Total bilirubin          7.2    5.0     NS
             INR                      2.0    1.8     NS
             Pre-LT ICU status        30.0%  15.6%   0.07
             Pre-LT hemodialysis      26.7%  15.6%   NS
             Previous upper abdominal surgery  30.0%  25.8%  NS
           Intra- and post-operative variables
             Cold ischemic time       367.7  350.2   NS
             Warm ischemic time       35.9    34.4   NS
             PRBC                     28.9   17.5    0.001
             Reentry                  40.0%  36.0%   NS
             Morbidity (≥ Clavien II)  43.3%  37.6%  NS
             LOS, total (days)        19.8   16.6    NS
           Age, MELD score, and the amount of blood loss were greater in patients
           who had PVT (bold print signifies significant values). The proportion of
           patients in the ICU with PVT was greater but only approached statistical
           significance.  With  logistic  regression,  the  only  pre-operative  factor
           independently associated with PVT was age (P = 0.037/HR = 0.95). Pre-LT:
           pre-liver transplant; LOS: length of stay; PVT: portal vein thrombosis; ICU:
           intensive care unit; MELD: model for end-stage liver disease; PRBC: packed
           red blood cell; HR: hazard ratio; NS: not significant
           90.3%, and 1-year were 83.7% and 83.3%. The patient and
           graft survival were inferior in those with PVT [Figure 1a].
           The divergence of both patient and graft survival occurred
           at approximately 6 months post-operatively. The patients   Figure 1: Patient survival and portal vein thrombosis (PVT). (a) PVT was
           with PVT at LT without a pre-LT diagnosis (“occult” PVT)   associated with significantly reduced survival at approximately 6 months.
           did not have inferior patient or graft survival as compared   Early perioperative survival (i.e., 90-day) was not significantly different, but
           to those with a definite pre-LT diagnosis (P = 0.79) [Figure   divergence in survival occurred at 6 months; (b) there was no difference
                                                              in survival between those with pre-liver transplantation diagnosis (pre-
           1b]. On multivariate  analysis  of patient  survival, only   PVT) and those with “occult” PVT (OR PVT). Results for graft survival
           MELD > 25 (P = 0.001, HR = 0.45) and age > 60 years   demonstrated the similar findings. On multivariate analysis [Table 3], PVT
                                                              was not an independent predictor of survival
           (P = 0.017, HR = 0.64) were independent risk factors for
           patient death. Similarly for graft survival, MELD > 25 (P   P = 0.001), patients with PVT did not have a longer LOS
           = 0.004, HR = 0.52) and age > 60 years (P = 0.013, HR   (19.8  vs. 16.6,  P = 0.36) or greater morbidity (43.3%  vs.
           = 0.67) predicted graft loss independently [Table 3]. The   37.6%, P > 0.05) [Table 2]. Only PVT (P = 0.002) and pre-LT
           presence of PVT diagnosed pre-LT or as an occult finding   hemodialysis (HD) (P = 0.013) were significant covariates
           was not an independent predictor of either  patient or   associated with increased PRBC [Figure 2]. When examining
           graft survival on multivariate analysis.
                                                              LOS, only female gender (P = 0.008), pre-LT HD (P = 0.012),
           LOS and PRBC requirements were also assessed. Although   and re-laparotomy (P < 0.0001) were significant at predicting
           PRBC requirements were greater with PVT (28.9 vs. 17.5,   the longer LOS [Figure 3].

            38                                                   Hepatoma Research | Volume 2 | Issue 2 | February 29, 2016