
Page 242 - Read Online
P. 242
12
40 DSA
10 DSA + additional CBCT
Number of nodule 4
30 8
6
Size (mm) 20 2
0
S1 S2 S3 S4 S5 S6 S7 S8
Location
Figure 2: The correlation between detection of nodule and its
10 location by DSA and DSA + CBCT. In any subsegments, extra
nodules detected by additional CBBT were less than two. No bias by
location was observed in nodule detection. DSA: digital subtraction
angiography; CBCT: cone-beam computed tomography
Detected by DSA Detected by
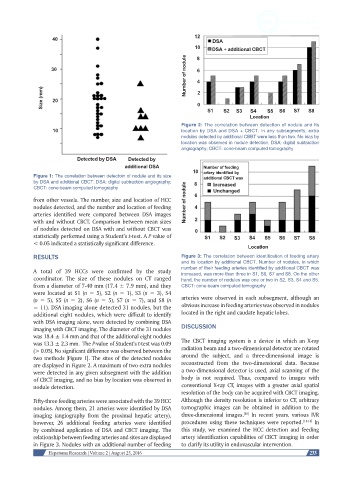
additional DSA Number of feeding
10 artery identified by
Figure 1: The correlation between detectoin of nodule and its size additional CBCT was
by DSA and additional CBCT. DSA: digital subtraction angiography; 8 Increased
CBCT: cone-beam computed tomography Unchanged
from other vessels. The number, size and location of HCC Number of nodule 6
nodules detected, and the number and location of feeding 4
arteries identified were compared between DSA images
with and without CBCT. Comparison between mean sizes 2
of nodules detected on DSA with and without CBCT was 0
statistically performed using a Student’s t-test. A P value of S1 S2 S3 S4 S5 S6 S7 S8
< 0.05 indicated a statistically significant difference.
Location
RESULTS Figure 3: The correlation between identification of feeding artery
and its location by additional CBCT. Number of nodules, in which
A total of 39 HCCs were confirmed by the study number of their feeding arteries identified by additional CBCT was
increased, was more than three in S1, S6, S7 and S8. On the other
coordinator. The size of these nodules on CT ranged hand, the number of nodules was one or two in S2, S3, S4 and S5.
from a diameter of 7-40 mm (17.4 ± 7.9 mm), and they CBCT: cone-beam computed tomography
were located at S1 (n = 5), S2 (n = 1), S3 (n = 3), S4
(n = 5), S5 (n = 2), S6 (n = 5), S7 (n = 7), and S8 (n arteries were observed in each subsegment, although an
= 11). DSA imaging alone detected 31 nodules, but the obvious increase in feeding arteries was observed in nodules
additional eight nodules, which were difficult to identify located in the right and caudate hepatic lobes.
with DSA imaging alone, were detected by combining DSA
imaging with CBCT imaging. The diameter of the 31 nodules DISCUSSION
was 18.4 ± 1.4 mm and that of the additional eight nodules
was 13.3 ± 2.3 mm. The P-value of Student’s t-test was 0.09 The CBCT imaging system is a device in which an X-ray
(> 0.05). No significant difference was observed between the radiation beam and a two-dimensional detector are rotated
two methods [Figure 1]. The sites of the detected nodules around the subject, and a three-dimensional image is
are displayed in Figure 2. A maximum of two extra nodules reconstructed from the two-dimensional data. Because
were detected in any given subsegment with the addition a two-dimensional detector is used, axial scanning of the
of CBCT imaging, and no bias by location was observed in body is not required. Thus, compared to images with
nodule detection. conventional X-ray CT, images with a greater axial spatial
resolution of the body can be acquired with CBCT imaging.
Fifty-three feeding arteries were associated with the 39 HCC Although the density resolution is inferior to CT, arbitrary
nodules. Among them, 21 arteries were identified by DSA tomographic images can be obtained in addition to the
imaging (angiography from the proximal hepatic artery), three-dimensional images. In recent years, various IVR
[10]
however, 26 additional feeding arteries were identified procedures using these techniques were reported. [11-14] In
by combined application of DSA and CBCT imaging. The this study, we examined the HCC detection and feeding
relationship between feeding arteries and sites are displayed artery identification capabilities of CBCT imaging in order
in Figure 3. Nodules with an additional number of feeding to clarify its utility in endovascular intervention.
Hepatoma Research | Volume 2 | August 25, 2016 233