
Page 199 - Read Online
P. 199
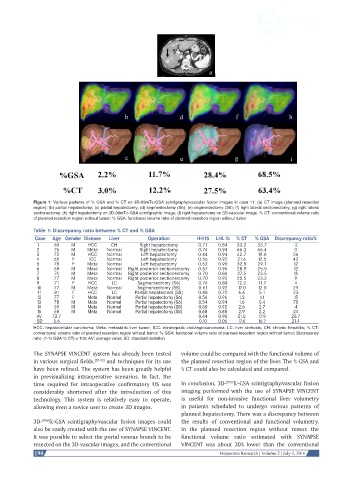
Figure 1: Various patterns of % GSA and % CT on 3D-99mTc-GSA scintigraphy/vascular fusion images in case 11. (a) CT image (planned resection
            region); (b) partial hepatectomy; (c) partial hepatectomy; (d) segmentectomy (S6); (e) segmentectomy (S6); (f) right lateral sectionectomy; (g) right lateral
            sectionectomy; (h) right hepatectomy on 3D-99mTc-GSA scintigraphic image; (i) right hepatectomy on 3D-vascular image. % CT: conventional volume ratio
            of planned resection region without tumor; % GSA: functional volume ratio of planned resection region without tumor

            Table 1: Discrepancy ratio between % CT and % GSA
             Case  Age Gender Disease  Liver       Operation       HH15   LHL15  % CT  % GSA  Discrepancy ratio%
             1     60    M     HCC    CH        Right hepatectomy   0.71   0.84  33.2   33.7        -2
             2     76    M    Meta   Normal     Right hepatectomy   0.74   0.94  66.3   66.4        0
             3     72    M     HCC   Normal      Left hepatectomy   0.44   0.94  42.7   19.0        56
             4     65    F     ICC   Normal      Left hepatectomy   0.56   0.92  21.6   12.5        42
             5     78    F    Meta   Normal      Left hepatectomy   0.62   0.90  32.9   29.1        12
             6     68    M    Meta   Normal  Right posterior sectionectomy  0.57  0.96  28.9  25.5  12
             7     74    M    Meta   Normal  Right posterior sectionectomy  0.70  0.86  27.5  23.5  15
             8     77    M    Meta   Normal  Right posterior sectionectomy  0.70  0.92  25.5  23.2  9
             9     71    F     HCC     LC      Segmentectomy (S6)   0.74   0.88  12.2   11.7        4
             10    77    M    Meta   Normal    Segmentectomy (S8)   0.61   0.92  17.0   12.0        29
             11    81    F     HCC     LC     Partial hepatectom (S8)  0.88  0.72  6.6  5.1         23
             12    77    F     Meta  Normal    Partial hepatectomy (S6)  0.56  0.96  1.3  1.1       15
             13    78    M     Meta   Normal   Partial hepatectomy (S6)  0.54  0.94  1.6  0.4       75
             14    69    M     Meta  Normal    Partial hepatectomy (S8)  0.60  0.92  2.6  2.7       -4
             15    68    M     Meta  Normal    Partial hepatectomy (S8)  0.68  0.88  2.9  2.2       24
             AV    72.7                                             0.64   0.90  21.5   17.9       20.7
             SD    5.6                                              0.10   0.06  17.6   16.7       21.4
            HCC: hepatocellular carcinoma; Meta: metastatic liver tumor; ICC: intrahepatic cholangiocarcinoma; LC: liver cirrhosis; CH: chronic hepatitis; % CT:
            conventional volume ratio of planned resection region without tumor; % GSA: functional volume ratio of planned resection region without tumor; Discrepancy
            ratio: (1-% GSA % CT) × 100; AV: average value; SD: standard deviation

            The SYNAPSE VINCENT system has already been tested   volume could be compared with the functional volume of
            in various surgical fields, [29-32]  and techniques for its use   the planned resection region of the liver. The % GSA and
            have been refined. The system has been greatly helpful   % CT could also be calculated and compared.
            in  previsualizing  intraoperative scenarios.  In  fact, the
            time  required for intraoperative confirmatory US was   In conclusion, 3D- 99m Tc-GSA scintigraphy/vascular fusion
            considerably shortened after the introduction of this   imaging performed with the use of SYNAPSE VINCENT
            technology.  This  system  is  relatively  easy  to operate,   is  useful for non-invasive  functional liver  volumetry
            allowing even a novice user to create 3D images.  in patients scheduled to undergo various patterns of
                                                              planned hepatectomy. There was a discrepancy between
            3D- 99m Tc-GSA  scintigraphy/vascular fusion  images  could   the results of conventional and functional volumetry.
            also be easily created with the use of SYNAPSE VINCENT.   In  the  planned resection  region  without  tumor,  the
            It was possible to select the portal venous branch to be   functional volume ratio estimated  with  SYNAPSE
            resected on the 3D-vascular images, and the conventional   VINCENT  was about 20% lower than the conventional
             190                                                           Hepatoma Research | Volume 2 | July 1, 2016