
Page 87 - Read Online
P. 87
a b c
d e
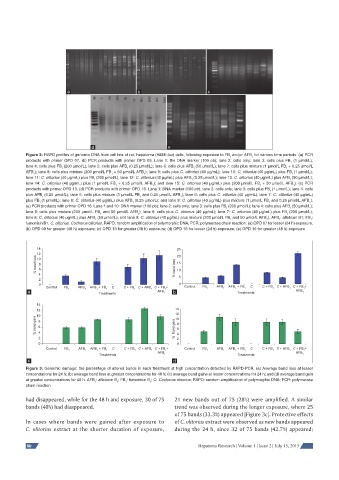
Figure 2: RAPD profi les of genomic DNA from cell line of rat, hepatoma (H4IIE-luc) cells, following exposure to FB and or AFB for various time periods. (a) PCR
1
1
/
products with primer OPD 07. (b) PCR products with primer OPD 09. Lane 1: the DNA marker (100 pb); lane 2: cells only; lane 3: cells plus FB (1 μmol/L);
1
lane 4: cells plus FB (200 μmol/L); lane 5: cells plus AFB (0.25 μmol/L); lane 6: cells plus AFB (50 μmol/L); lane 7: cells plus mixture (1 μmol/L FB + 0.25 μmol/L
1
1
1
1
AFB ); lane 8: cells plus mixture (200 μmol/L FB + 50 μmol/L AFB ); lane 9: cells plus C. olitorius (40 μg/mL); lane 10: C. olitorius (40 μg/mL) plus FB (1 μmol/L);
1
1
1
1
lane 11: C. olitorius (40 μg/mL) plus FB (200 μmol/L); lane 12: C. olitorius (40 μg/mL) plus AFB (0.25 μmol/L); lane 13: C. olitorius (40 μg/mL) plus AFB (50 μmol/L);
1
1
1
lane 14: C. olitorius (40 μg/mL) plus (1 μmol/L FB + 0.25 μmol/L AFB ); and lane 15: C. olitorius (40 μg/mL) plus (200 μmol/L FB + 50 μmol/L AFB ). (c) PCR
1
1
1
1
products with primer OPD 13. (d) PCR products with primer OPD 16. Lane 1: DNA marker (100 pb); lane 2: cells only; lane 3: cells plus FB (1 μmol/L); lane 4: cells
1
plus AFB (0.25 μmol/L); lane 5: cells plus mixture (1 μmol/L FB and 0.25 μmol/L AFB ); lane 6: cells plus C. olitorius (40 μg/mL); lane 7: C. olitorius (40 μg/mL)
1
1
1
plus FB (1 μmol/L); lane 8: C. olitorius (40 μg/mL) plus AFB (0.25 μmol/L); and lane 9: C. olitorius (40 μg/mL) plus mixture (1 μmol/L FB and 0.25 μmol/L AFB ).
1
1
1
1
(e) PCR products with primer OPD 16. Lane 1 and 10: DNA marker (100 pb); lane 2: cells only; lane 3: cells plus FB (200 μmol/L); lane 4: cells plus AFB (50 μmol/L);
1
1
lane 5: cells plus mixture (200 μmol/L FB and 50 μmol/L AFB ); lane 6: cells plus C. olitorius (40 μg/mL); lane 7: C. olitorius (40 μg/mL) plus FB (200 μmol/L);
1
1
1
lane 8: C. olitorius (40 μg/mL) plus AFB (50 μmol/L); and lane 9: C. olitorius (40 μg/mL) plus mixture (200 μmol/L FB and 50 μmol/L AFB ). AFB : afl atoxin B1; FB :
1
1
1
1
1
fumonisin B1; C. olitorius: Cochorus olitorius; RAPD: random amplifi cation of polymorphic DNA; PCR: polymerase chain reaction. (a) OPD 07 for lesser (24 h) exposure;
(b) OPD 09 for greater (48 h) exposure; (c) OPD 13 for greater (48 h) exposure; (d) OPD 16 for lesser (24 h) exposure; (e) OPD 16 for greater (48 h) exposure
14
25
12 20
% band loss 10 8 % band loss 15
4 6 10
5
2
C Control C + FB 1 C + AFB 1 C + FB 1 +
0 0 C
Control FB 1 AFB 1 AFB 1 + FB 1 C + FB 1 C + AFB 1 C + FB 1 + FB 1 AFB 1 AFB 1 + FB 1
a AFB 1 b AFB 1
Treatments Treatments
14
14
12 12
% band gain 8 6 % band gain 10 8 6
10
2 4 4
2
0 0
C C C
Control FB 1 AFB 1 AFB 1 + FB 1 C + FB 1 C + AFB 1 C + FB 1 + Control FB 1 AFB 1 AFB 1 + FB 1 + FB 1 C + AFB 1 C + FB 1 +
Treatments AFB 1 Treatments AFB 1
c d
Figure 3: Genomic damage: the percentage of altered bands in each treatment at high concentration detected by RAPD-PCR. (a) Average band loss at lesser
concentrations for 24 h; (b) average band loss at greater concentrations for 48 h; (c) average band gains at lesser concentrations for 24 h; and (d) average band gain
at greater concentrations for 48 h. AFB : afl atoxin B ; FB : fumonisin B ; C: Cochorus olitorius; RAPD: random amplifi cation of polymorphic DNA; PCR: polymerase
1 1 1 1
chain reaction
had disappeared, while for the 48 h and exposure, 30 of 75 21 new bands out of 75 (28%) were amplified. A similar
bands (40%) had disappeared. trend was observed during the longer exposure, where 25
of 75 bands (33.3%) appeared [Figure 3c]. Protective effects
In cases where bands were gained after exposure to of C. olitorius extract were observed as new bands appeared
C. olitorius extract at the shorter duration of exposure, during the 24 h, since 32 of 75 bands (42.7%) appeared;
80 Hepatoma Research | Volume 1 | Issue 2 | July 15, 2015