
Page 88 - Read Online
P. 88
during the longer exposure, 23 of 75 bands (30.7%) DISCUSSION
disappeared [Figure 3d].
Aflatoxin B and FB are the most frequently observed
1 1
When OPD 9 primer was used, a maximum of 10 RAPD-PCR mycotoxins in food and animal feed. In African and European
[43]
disappeared when cells were exposed to the mixture countries, both mycotoxins are found in maize. Toxicity
of FB and AFB + aqueous extract of C. olitorius for and carcinogenicity of AFB , which has been classified
1 1 1
48 h [Table 4]. However, when with OPD 15 was used as Group 1 carcinogen are thought to be directly linked
as the primer, the maximum appearance of new bands to its bioactivation, resulting in a reactive form of AFB ,
1
showed the same number of bands lost (10) that was the 8, 9-epoxide. Bioactivation of AFB occurs primarily by a
1
observed in cells exposed to AFB + aqueous extract of microsomal cytochrome P450-dependent epoxidation of the
1
C. olitorius after 24 h. terminal furan ring of AFB , which is responsible for binding
1
to cellular macromolecules such as DNA, RNA and other
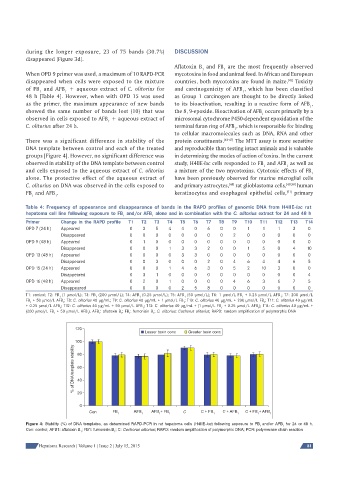
There was a significant difference in stability of the protein constituents. [44-47] The MTT assay is more sensitive
DNA template between control and each of the treated and reproducible than testing intact animals and is valuable
groups [Figure 4]. However, no significant difference was in determining the modes of action of toxins. In the current
observed in stability of the DNA template between control study, H4IIE-luc cells responded to FB and AFB as well as
1
1
and cells exposed to the aqueous extract of C. olitorius a mixture of the two mycotoxins. Cytotoxic effects of FB
1
alone. The protective effect of the aqueous extract of have been previously observed for murine microglial cells
C. olitorius on DNA was observed in the cells exposed to and primary astrocytes, rat glioblastoma cells, [49,50] human
[48]
FB and AFB . keratinocytes and esophageal epithelial cells, primary
[51]
1
1
Table 4: Frequency of appearance and disappearance of bands in the RAPD profiles of genomic DNA from H4IIE-luc rat
hepatoma cell line following exposure to FB and/or AFB alone and in combination with the C. olitorius extract for 24 and 48 h
1 1
Primer Change in the RAPD profi le T1 T2 T3 T4 T5 T6 T7 T8 T9 T10 T11 T12 T13 T14
OPD 7 (24 h) Appeared 0 3 5 4 4 0 6 0 0 1 1 1 3 0
Disappeared 0 0 0 0 0 0 0 0 2 0 0 0 0 0
OPD 9 (48 h) Appeared 0 1 0 0 0 0 0 0 0 0 0 0 0 0
Disappeared 0 0 0 1 3 3 2 0 0 1 5 0 4 10
OPD 13 (48 h) Appeared 0 0 0 0 3 3 0 0 0 0 0 0 0 0
Disappeared 0 0 3 0 0 0 2 0 4 6 4 4 6 5
OPD 15 (24 h) Appeared 0 0 0 1 4 6 3 0 5 2 10 3 0 0
Disappeared 0 3 1 0 0 0 0 0 0 0 0 0 0 4
OPD 16 (48 h) Appeared 0 2 0 1 0 0 0 0 4 6 3 6 7 5
Disappeared 0 0 0 0 2 5 8 0 0 0 0 0 0 0
T1: control; T2: FB (1 μmol/L); T3: FB (200 μmol/L); T4: AFB (0.25 μmol/L); T5: AFB (50 μmol/L); T6: 1 μmol/L FB + 0.25 μmol/L AFB ; T7: 200 μmol/L
1 1 1 1 1 1
FB + 50 μmol/L AFB ; T8: C. olitorius 40 μg/mL; T9: C. olitorius 40 μg/mL + 1 μmol/L FB ; T10: C. olitorius 40 μg/mL + 200 μmol/L FB ; T11: C. olitorius 40 μg/mL
1 1 1 1
+ 0.25 μmol/L AFB ; T12: C. olitorius 40 μg/mL + 50 μmol/L AFB ; T13: C. olitorius 40 μg/mL + (1 μmol/L FB + 0.25 μmol/L AFB ); T14: C. olitorius 40 μg/mL +
1 1 1 1
(200 μmol/L FB + 50 μmol/L AFB ). AFB : afl atoxin B ; FB : fumonisin B ; C. olitorius: Cochorus olitorius; RAPD: random amplifi cation of polymorphic DNA
1 1 1 1 1 1
120
Lesser toxin conc Greater toxin conc
100
% of DNA template stability 80
60
40
20
0
C
FB AFB AFB + FB C + FB C + AFB C + FB + AFB
Con
1 1 1 1 1 1 1 1
Figure 4: Stability (%) of DNA templates, as determined RAPD-PCR in rat hepatoma cells (H4IIE-luc) following exposure to FB and/or AFB for 24 or 48 h.
1
1
Con: control; AFB1: afl atoxin B ; FB1: fumonisin B ; C: Cochorus olitorius; RAPD: random amplifi cation of polymorphic DNA; PCR: polymerase chain reaction
1
1
Hepatoma Research | Volume 1 | Issue 2 | July 15, 2015 81