
Page 24 - Read Online
P. 24
Allen et al. Hepatoma Res 2021;7:73 https://dx.doi.org/10.20517/2394-5079.2021.98 Page 5 of 15
[68]
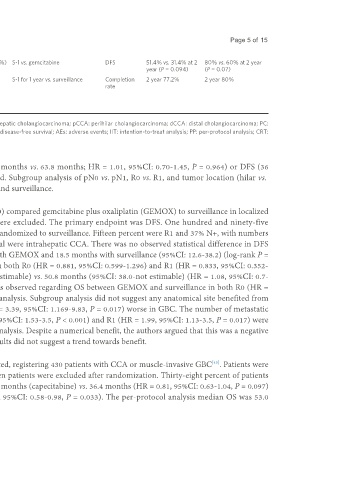
KHBO1208 2019 Phase II CCA, GBC 70 32/70 12/70 (17.1%) S-1 vs. gemcitabine DFS 51.4% vs. 31.4% at 2 80% vs. 60% at 2 year
(NCT01815307) (45.7%) year (P = 0.094) (P = 0.07)
TOSBIC01 2020 Phase II pCCA/dCCA 19 20/46 (46%) 3/46 (7%) S-1 for 1 year vs. surveillance Completion 2 year 77.2% 2 year 80%
[69]
Itano et al. GBC 10 rate
(UMIN000009029) iCCA 8
Ampullary 9
(total 46)
*Median unless stated otherwise. CCA: Cholangiocarcinoma; GBC: gallbladder carcinoma; iCCA: intrahepatic cholangiocarcinoma; pCCA: perihilar cholangiocarcinoma; dCCA: distal cholangiocarcinoma; PC:
pancreatic carcinoma; MMC: mitomycin C; GEMOX: gemcitabine + oxaliplatin; OS: overall survival; DFS: disease-free survival; AEs: adverse events; IIT: intention-to-treat analysis; PP: per-protocol analysis; CRT:
chemoradiotherapy; NR: no result.
(34.7%) were N+ and only 25 (11.1%) R1. No difference in median OS (62.3 months vs. 63.8 months; HR = 1.01, 95%CI: 0.70-1.45, P = 0.964) or DFS (36
months vs. 39.9 months; HR = 0.93, 95%CI: 0.66-1.32, P = 0.693) was observed. Subgroup analysis of pN0 vs. pN1, R0 vs. R1, and tumor location (hilar vs.
distal) did not demonstrate survival differences between adjuvant gemcitabine and surveillance.
[42]
PRODIGE 12-ACCORD 18 by Edeline et al. (2018; EudraCT 2008-004560-39) compared gemcitabine plus oxaliplatin (GEMOX) to surveillance in localized
biliary tract cancers with either an R0 or R1 resection. Ampullary cancers were excluded. The primary endpoint was DFS. One hundred and ninety-five
patients were included in the analysis, 95 of whom received GEMOX, with 99 randomized to surveillance. Fifteen percent were R1 and 37% N+, with numbers
balanced between both arms. Approximately 45% of those included in this trial were intrahepatic CCA. There was no observed statistical difference in DFS
between the two arms, with the median DFS 30.4 months (95%CI: 15.4-43.0) with GEMOX and 18.5 months with surveillance (95%CI: 12.6-38.2) (log-rank P =
0.47). No difference in DFS was observed between GEMOX and surveillance in both R0 (HR = 0.881, 95%CI: 0.599-1.296) and R1 (HR = 0.833, 95%CI: 0.352-
1.972) subgroup analysis. The median OS was 75.8 months (95%CI: 34.4-not estimable) vs. 50.8 months (95%CI: 38.0-not estimable) (HR = 1.08, 95%CI: 0.7-
1.66, P = 0.74). The 2-year OS was 69% vs. 76%, respectively. No difference was observed regarding OS between GEMOX and surveillance in both R0 (HR =
1.03, 95%CI: 0.635-1.671) and R1 (HR = 1.203, 95%CI: 0.446-3.244) subgroup analysis. Subgroup analysis did not suggest any anatomical site benefited from
GEMOX, with DFS (HR = 2.559, 95%CI: 1.037-6.318, P = 0.034) and OS (HR = 3.39, 95%CI: 1.169-9.83, P = 0.017) worse in GBC. The number of metastatic
recurrences recorded was 41 (75%) and 43 (71%), respectively. N+ (HR = 2.31, 95%CI: 1.53-3.5, P < 0.001) and R1 (HR = 1.99, 95%CI: 1.13-3.5, P = 0.017) were
both identified as independent predictors of worse survival in a multi-variate analysis. Despite a numerical benefit, the authors argued that this was a negative
trial rather than underpowered and that with an OS hazard ratio of 1.08, the results did not suggest a trend towards benefit.
BILCAP (2019; EudraCT 2005-003318-13) is the largest phase III study completed, registering 430 patients with CCA or muscle-invasive GBC . Patients were
[43]
randomized to either capecitabine (n = 210) or surveillance (n = 220). Seventeen patients were excluded after randomization. Thirty-eight percent of patients
were R1 and 47% N+. In the intention-to-treat analysis the median OS was 51.1 months (capecitabine) vs. 36.4 months (HR = 0.81, 95%CI: 0.63-1.04, P = 0.097)
while the median DFS was 24.4 months vs. 17.5 months (adjusted HR = 0.75, 95%CI: 0.58-0.98, P = 0.033). The per-protocol analysis median OS was 53.0