
Page 22 - Read Online
P. 22
Page 4 of 15 Allen et al. Hepatoma Res 2021;7:73 https://dx.doi.org/10.20517/2394-5079.2021.98
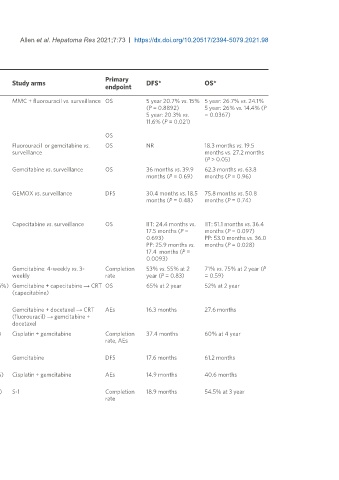
Table 1. Select completed clinical trials of adjuvant chemotherapy in biliary tract cancers
Node Margin
Trial Year Trial Tumor site No. of positive n positive n Study arms Primary DFS* OS*
name/ID/author type/name patients endpoint
(%) (%)
[39]
Takada et al. 2002 Phase III CCA 118/508 102 (86%) NR MMC + fluorouracil vs. surveillance OS 5 year 20.7% vs. 15% 5 year: 26.7% vs. 24.1%
(P = 0.8892) 5 year: 26% vs. 14.4% (P
5 year: 20.3% vs. = 0.0367)
11.6% (P = 0.021)
105 (94%)
GBC 112/508 NR OS
ESPAC-3 2012 Phase III dCCA 96 of 434 251/434 68/434 Fluorouracil or gemcitabine vs. OS NR 18.3 months vs. 19.5
[40]
Neoptolemos et al. (57.8%) (15.7%) surveillance months vs. 27.2 months
NCT00058201 (P > 0.05)
BCAT 2017 Phase III pCCA, dCCA 225 78/225 25/225 Gemcitabine vs. surveillance OS 36 months vs. 39.9 62.3 months vs. 63.8
[41]
Ebata et al. (34.7%) (11.1%) months (P = 0.69) months (P = 0.96)
(UMIN000000820)
PRODIGE 12- 2019 Phase III CCA, GBC 194 71/194 25/194 GEMOX vs. surveillance DFS 30.4 months vs. 18.5 75.8 months vs. 50.8
ACCORD-18 (36.6%) (12.9%) months (P = 0.48) months (P = 0.74)
[42]
Edeline at al.
(NCT01313377)
BILCAP 2019 Phase III CCA, GBC 447 210/447 168/447 Capecitabine vs. surveillance OS IIT: 24.4 months vs. IIT: 51.1 months vs. 36.4
[43]
Primrose et al. (47%) (37.6%) 17.5 months (P = months (P = 0.097)
(NCT00363584) 0.693) PP: 53.0 months vs. 36.0
PP: 25.9 months vs. months (P = 0.028)
17.4 months (P =
0.0093)
[62]
Kobayashi et al. 2011 Phase II pCCA, dCCA, 27 NR NR Gemcitabine: 4-weekly vs. 3- Completion 53% vs. 55% at 2 71% vs. 75% at 2 year (P
(UMIN000001020) GBC, PC weekly rate year (P = 0.83) = 0.59)
SWOG S0809 2014 Phase II pCCA, dCCA, 79 NR 25/79 (31.6%) Gemcitabine + capecitabine → CRT OS 65% at 2 year 52% at 2 year
[45]
Ben-Josef et al. GBC (capecitabine)
(NCT00789958)
[63]
Cho et al. 2014 Phase II CCA, GBC 12 (of 50) 15/21 (71.4%) NR Gemcitabine + docetaxel → CRT AEs 16.3 months 27.6 months
(NCT00660699) (fluorouracil) → gemcitabine +
docetaxel
[64]
Kainuma et al. 2015 Phase II CCA, GBC, PC 29 14/29 9/29 (31%) Cisplatin + gemcitabine Completion 37.4 months 60% at 4 year
(UMIN000001294) (Feasibility (48.3%) rate, AEs
study)
[65]
Woo et al. 2017 Phase II CCA, GBC 72 32/72 0 Gemcitabine DFS 17.6 months 61.2 months
(NCT01043172) (44.4%)
[66]
Siebenhüner et al. 2018 Phase II iCCA, pCCA, 30 10/30 2/30 (6.7%) Cisplatin + gemcitabine AEs 14.9 months 40.6 months
(NCT01073839) GBC (33.3%)
[67]
Nakachi et al. 2018 Phase II CCA, GBC, PC 33 17/33 3/33 (9.1%) S-1 Completion 18.9 months 54.5% at 3 year
(UMIN000004051) (51.5%) rate