
Page 69 - Read Online
P. 69
Page 10 of 15 Kato et al. Hepatoma Res 2021;7:10 I http://dx.doi.org/10.20517/2394-5079.2020.129
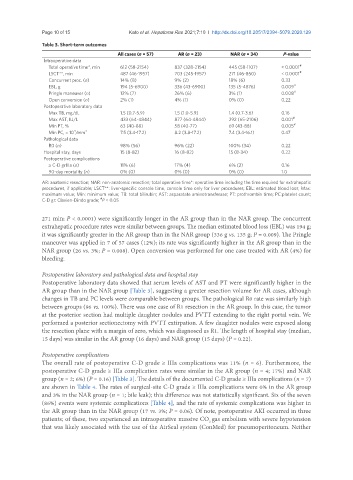
Table 3. Short-term outcomes
All cases (n = 57) AR (n = 23) NAR (n = 34) P-value
Intraoperative data
Total operative time*, min 612 (58-2154) 837 (328-2154) 445 (58-1107) < 0.0001 #
LSCT**, min 487 (46-1957) 703 (245-1957) 271 (46-850) < 0.0001 #
Concurrent proc. (n) 14% (8) 9% (2) 18% (6) 0.33
EBL, g 194 (5-6900) 336 (43-6900) 135 (5-4876) 0.009 #
Pringle maneuver (n) 12% (7) 26% (6) 3% (1) 0.008 #
Open conversion (n) 2% (1) 4% (1) 0% (0) 0.22
Postoperative laboratory data
Max TB, mg/dL 1.5 (0.7-5.9) 1.5 (1.0-5.9) 1.4 (0.7-3.6) 0.16
Max AST, IU/L 433 (64-4844) 877 (64-4844) 292 (65-2106) 0.001 #
Min PT, % 63 (40-88) 58 (40-77) 69 (43-88) 0.005 #
4
Min PC, × 10 /mm 3 7.5 (3.4-17.2) 8.2 (3.8-17.2) 7.4 (3.4-16.1) 0.47
Pathological data
R0 (n) 98% (56) 96% (22) 100% (34) 0.22
Hospital stay, days 15 (8-82) 16 (8-82) 15 (8-34) 0.22
Postoperative complications
≥ C-D grIIIa (n) 11% (6) 17% (4) 6% (2) 0.16
90-day mortality (n) 0% (0) 0% (0) 0% (0) 1.0
AR: anatomic resection; NAR: non-anatomic resection; total operative time*: operative time including the time required for extrahepatic
procedures, if applicable; LSCT**: liver-specific console time, console time only for liver procedures; EBL: estimated blood loss; Max:
maximum value; Min: minimum value; TB: total bilirubin; AST: asparatate aminotransferase; PT: prothrombin time; PC:platelet count;
#
C-D gr: Clavien-Dindo grade; P < 0.05
271 min; P < 0.0001) were significantly longer in the AR group than in the NAR group. The concurrent
extrahepatic procedure rates were similar between groups. The median estimated blood loss (EBL) was 194 g;
it was significantly greater in the AR group than in the NAR group (336 g vs. 135 g; P = 0.009). The Pringle
maneuver was applied in 7 of 57 cases (12%); its rate was significantly higher in the AR group than in the
NAR group (26 vs. 3%; P = 0.008). Open conversion was performed for one case treated with AR (4%) for
bleeding.
Postoperative laboratory and pathological data and hospital stay
Postoperative laboratory data showed that serum levels of AST and PT were significantly higher in the
AR group than in the NAR group [Table 3], suggesting a greater resection volume for AR cases, although
changes in TB and PC levels were comparable between groups. The pathological R0 rate was similarly high
between groups (96 vs. 100%). There was one case of R1 resection in the AR group. In this case, the tumor
at the posterior section had multiple daughter nodules and PVTT extending to the right portal vein. We
performed a posterior sectionectomy with PVTT extirpation. A few daughter nodules were exposed along
the resection plane with a margin of zero, which was diagnosed as R1. The length of hospital stay (median,
15 days) was similar in the AR group (16 days) and NAR group (15 days) (P = 0.22).
Postoperative complications
The overall rate of postoperative C-D grade ≥ IIIa complications was 11% (n = 6). Furthermore, the
postoperative C-D grade ≥ IIIa complication rates were similar in the AR group (n = 4; 17%) and NAR
group (n = 2; 6%) (P = 0.16) [Table 3]. The details of the documented C-D grade ≥ IIIa complications (n = 7)
are shown in Table 4. The rates of surgical-site C-D grade ≥ IIIa complications were 0% in the AR group
and 3% in the NAR group (n = 1; bile leak); this difference was not statistically significant. Six of the seven
(86%) events were systemic complications [Table 4], and the rate of systemic complications was higher in
the AR group than in the NAR group (17 vs. 3%; P = 0.06). Of note, postoperative AKI occurred in three
patients; of these, two experienced an intraoperative massive CO gas embolism with severe hypotension
2
that was likely associated with the use of the AirSeal system (ConMed) for pneumoperitoneum. Neither