
Page 113 - Read Online
P. 113
Page 4 of 12 Pegoraro et al. Hepatoma Res 2021;7:24 https://dx.doi.org/10.20517/2394-5079.2020.142
®
Table 1. Volumetry of the patient’s liver as reconstructed by Synapse 3D Software, before RALPP stage I and before RALPP stage II
PRE RALPP stage I PRE RALPP stage II
TLV 1046 mL 1220 mL
NTLV 987 mL 1161 mL
TlV 59 mL
Sg8 lesion max diameter 51.2 mm
volume 37 mL
Sg6 lesion max diameter 43.4 mm
volume 22 mL
NTLV/TLV 94.35% 95.16%
TlV/TLV 5.64% 4.83%
TlV/NTLV 5.98% 5.08%
MHV MHV Final
preservation excision volumes
Computed FLR 282 mL (28.6%) 264 mL (26.7%) 538 mL (46.3%)
Computed resection volume 764 mL (71.4%) 783 mL (73.3%) 682 mL (53.7%)
Computed resection on TLV 73.04% 74.85% 55.90%
Computed resection on NTLV 77.41% 79.33% 58.74%
TLV: Total liver volume; NTLV: non-tumoral liver volume; TlV: total lesion volume; FLR: future liver remnant; MHV: middle hepatic vein.
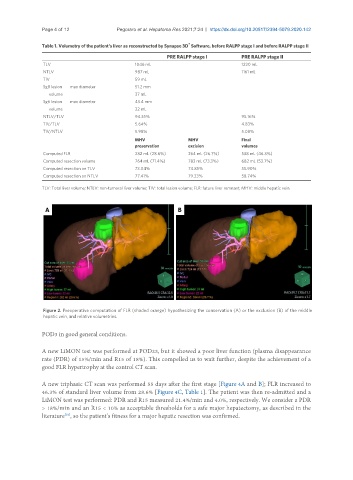
Figure 2. Preoperative computation of FLR (shaded orange) hypothesizing the conservation (A) or the exclusion (B) of the middle
hepatic vein, and relative volumetries.
POD3 in good general conditions.
A new LiMON test was performed at POD23, but it showed a poor liver function (plasma disappearance
rate (PDR) of 15%/min and R15 of 18%). This compelled us to wait further, despite the achievement of a
good FLR hypertrophy at the control CT scan.
A new triphasic CT scan was performed 55 days after the first stage [Figure 4A and B]; FLR increased to
46.3% of standard liver volume from 28.6% [Figure 4C, Table 1]. The patient was then re-admitted and a
LiMON test was performed: PDR and R15 measured 21.4%/min and 4.0%, respectively. We consider a PDR
> 18%/min and an R15 < 10% as acceptable thresholds for a safe major hepatectomy, as described in the
literature , so the patient’s fitness for a major hepatic resection was confirmed.
[18]