
Page 13 - Read Online
P. 13
Page 8 of 20 Hamawandi et al. Energy Mater. 2025, 5, 500065 https://dx.doi.org/10.20517/energymater.2024.204
Figure 3. SEM and TEM micrographs of (A and C) as-made Bi Te and (B and D) Sb Te samples synthesized through MW-assisted
2 3 2 3
thermolysis.
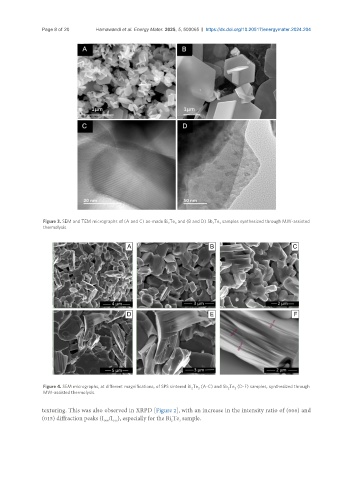
Figure 4. SEM micrographs, at different magnifications, of SPS sintered Bi Te (A-C) and Sb Te (D-F) samples, synthesized through
2
3
2
3
MW-assisted thermolysis.
texturing. This was also observed in XRPD [Figure 2], with an increase in the intensity ratio of (006) and
(015) diffraction peaks (I /I ), especially for the Bi Te sample.
015
006
3
2