
Page 10 - Read Online
P. 10
Hamawandi et al. Energy Mater. 2025, 5, 500065 https://dx.doi.org/10.20517/energymater.2024.204 Page 5 of 20
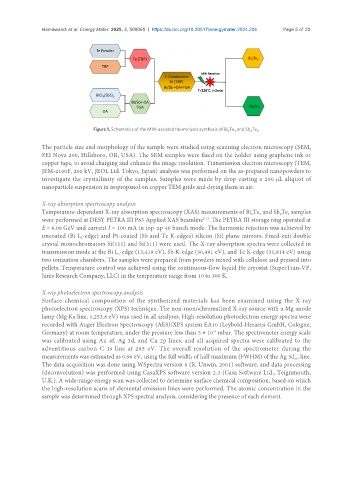
Figure 1. Schematics of the MW-assisted thermolysis synthesis of Bi Te and Sb Te . 3
3
2
2
The particle size and morphology of the sample were studied using scanning electron microscopy (SEM,
FEI Nova 200, Hillsboro, OR, USA). The SEM samples were fixed on the holder using graphene ink or
copper tape, to avoid charging and enhance the image resolution. Transmission electron microscopy (TEM,
JEM-2100F, 200 kV, JEOL Ltd. Tokyo, Japan) analysis was performed on the as-prepared nanopowders to
investigate the crystallinity of the samples. Samples were made by drop casting a 200 μL aliquot of
nanoparticle suspension in isopropanol on copper TEM grids and drying them in air.
X-ray absorption spectroscopy analysis
Temperature-dependent X-ray absorption spectroscopy (XAS) measurements of Bi Te and Sb Te samples
2
3
3
2
[37]
were performed at DESY PETRA III P65 Applied XAS beamline . The PETRA III storage ring operated at
E = 6.08 GeV and current I = 100 mA in top-up 40 bunch mode. The harmonic rejection was achieved by
uncoated (Bi L -edge) and Pt-coated (Sb and Te K-edges) silicon (Si) plane mirrors. Fixed-exit double
3
crystal monochromators Si(111) and Si(311) were used. The X-ray absorption spectra were collected in
transmission mode at the Bi L -edge (13,419 eV), Sb K-edge (30,491 eV), and Te K-edge (31,814 eV) using
3
two ionization chambers. The samples were prepared from powders mixed with cellulose and pressed into
pellets. Temperature control was achieved using the continuous-flow liquid He cryostat (SuperTran-VP,
Janis Research Company, LLC) in the temperature range from 10 to 300 K.
X-ray photoelectron spectroscopy analysis
Surface chemical composition of the synthesized materials has been examined using the X-ray
photoelectron spectroscopy (XPS) technique. The non-monochromatized X-ray source with a Mg anode
lamp (Mg Kα line, 1,253.6 eV) was used in all analyses. High-resolution photoelectron energy spectra were
recorded with Auger Electron Spectroscopy (AES)/XPS system EA10 (Leybold-Heraeus GmbH, Cologne,
Germany) at room temperature, under the pressure less than 5 × 10 mbar. The spectrometer energy scale
-8
was calibrated using Au 4f, Ag 3d, and Cu 2p lines, and all acquired spectra were calibrated to the
adventitious carbon C 1s line at 285 eV. The overall resolution of the spectrometer during the
measurements was estimated as 0.96 eV, using the full width of half maximum (FWHM) of the Ag 3d line.
5/2
The data acquisition was done using WSpectra version 8 (R. Unwin, 2001) software, and data processing
(deconvolution) was performed using CasaXPS software version 2.3 (Casa Software Ltd., Teignmouth,
U.K.). A wide-range energy scan was collected to determine surface chemical composition, based on which
the high-resolution scans of elemental emission lines were performed. The atomic concentration in the
sample was determined through XPS spectral analysis, considering the presence of each element.