
Page 12 - Read Online
P. 12
Hamawandi et al. Energy Mater. 2025, 5, 500065 https://dx.doi.org/10.20517/energymater.2024.204 Page 7 of 20
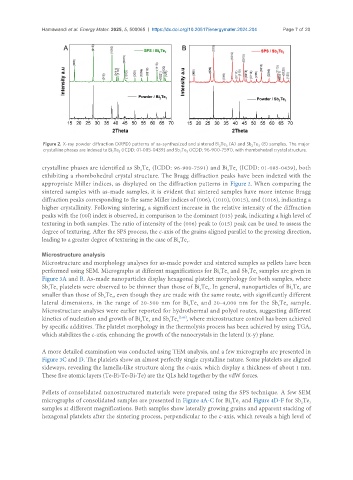
Figure 2. X-ray powder diffraction (XRPD) patterns of as-synthesized and sintered Bi Te (A) and Sb Te (B) samples. The major
2
3
2
3
crystalline phases are indexed to Bi Te (ICDD: 01-085-0439) and Sb Te (ICDD: 96-900-7591), with rhombohedral crystal structure.
3
2
2
3
crystalline phases are identified as Sb Te (ICDD: 96-900-7591) and Bi Te (ICDD: 01-085-0439), both
2
2
3
3
exhibiting a rhombohedral crystal structure. The Bragg diffraction peaks have been indexed with the
appropriate Miller indices, as displayed on the diffraction patterns in Figure 2. When comparing the
sintered samples with as-made samples, it is evident that sintered samples have more intense Bragg
diffraction peaks corresponding to the same Miller indices of (006), (1010), (0015), and (1016), indicating a
higher crystallinity. Following sintering, a significant increase in the relative intensity of the diffraction
peaks with the (00l) index is observed, in comparison to the dominant (015) peak, indicating a high level of
texturing in both samples. The ratio of intensity of the (006) peak to (015) peak can be used to assess the
degree of texturing. After the SPS process, the c-axis of the grains aligned parallel to the pressing direction,
leading to a greater degree of texturing in the case of Bi Te .
2
3
Microstructure analysis
Microstructure and morphology analyses for as-made powder and sintered samples as pellets have been
performed using SEM. Micrographs at different magnifications for Bi Te and Sb Te samples are given in
3
2
3
2
Figure 3A and B. As-made nanoparticles display hexagonal platelet morphology for both samples, where
Sb Te platelets were observed to be thinner than those of Bi Te . In general, nanoparticles of Bi Te are
2
3
3
2
3
2
smaller than those of Sb Te , even though they are made with the same route, with significantly different
3
2
lateral dimensions, in the range of 20-500 nm for Bi Te and 20-4,000 nm for the Sb Te sample.
3
2
3
2
Microstructure analyses were earlier reported for hydrothermal and polyol routes, suggesting different
kinetics of nucleation and growth of Bi Te and Sb Te 3 [3,49] , where microstructure control has been achieved
2
3
2
by specific additives. The platelet morphology in the thermolysis process has been achieved by using TGA,
which stabilizes the c-axis, enhancing the growth of the nanocrystals in the lateral (x-y) plane.
A more detailed examination was conducted using TEM analysis, and a few micrographs are presented in
Figure 3C and D. The platelets show an almost perfectly single crystalline nature. Some platelets are aligned
sideways, revealing the lamella-like structure along the c-axis, which display a thickness of about 1 nm.
These five atomic layers (Te-Bi-Te-Bi-Te) are the QLs held together by the vdW forces.
Pellets of consolidated nanostructured materials were prepared using the SPS technique. A few SEM
micrographs of consolidated samples are presented in Figure 4A-C for Bi Te and Figure 4D-F for Sb Te
3
2
3
2
samples at different magnifications. Both samples show laterally growing grains and apparent stacking of
hexagonal platelets after the sintering process, perpendicular to the c-axis, which reveals a high level of