
Page 62 - Read Online
P. 62
Page 10 of 21 Guo et al. Energy Mater. 2025, 5, 500041 https://dx.doi.org/10.20517/energymater.2024.214
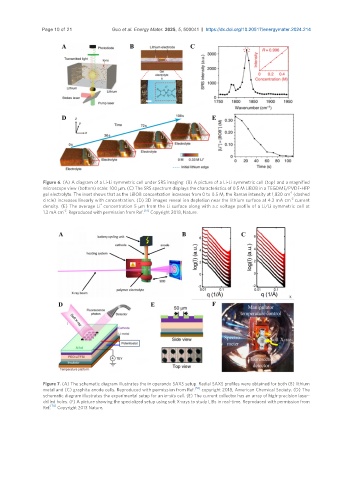
Figure 6. (A) A diagram of a Li-Li symmetric cell under SRS imaging. (B) A picture of a Li-Li symmetric cell (top) and a magnified
microscope view (bottom) scale: 100 μm. (C) The SRS spectrum displays the characteristics of 0.5 M LiBOB in a TEGDME/PVDF-HFP
-1
gel electrolyte. The inset shows that as the LiBOB concentration increases from 0 to 0.5 M, the Raman intensity at 1,830 cm (dashed
-2
circle) increases linearly with concentration. (D) 3D images reveal ion depletion near the lithium surface at 4.2 mA cm current
+
density. (E) The average Li concentration 5 μm from the Li surface along with a.c voltage profile of a Li/Li symmetric cell at
-2
1.3 mA cm . Reproduced with permission from Ref. [57] Copyright 2018, Nature.
Figure 7. (A) The schematic diagram illustrates the in operando SAXS setup. Radial SAXS profiles were obtained for both (B) lithium
metal and (C) graphite anode cells. Reproduced with permission from Ref. [56] copyright 2018, American Chemical Society. (D) The
schematic diagram illustrates the experimental setup for an in-situ cell. (E) The current collector has an array of high-precision laser-
drilled holes. (F) A picture showing the specialized setup using soft X-rays to study LIBs in real-time. Reproduced with permission from
Ref. [76] Copyright 2013 Nature.