
Page 109 - Read Online
P. 109
Chen et al. Energy Mater. 2025, 5, 500064 https://dx.doi.org/10.20517/energymater.2024.163 Page 9 of 14
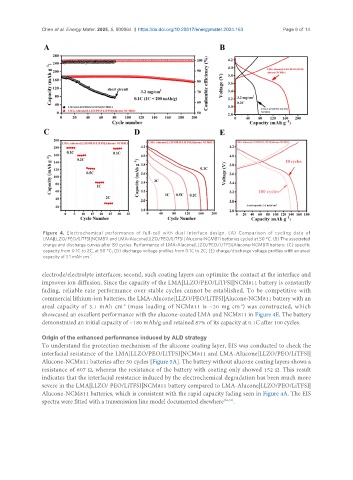
Figure 4. Electrochemical performance of full-cell with dual interface design. (A) Comparison of cycling data of
LMA|LLZO/PEO/LiTFSI|NCM811 and LMA-Alucone|LLZO/PEO/LiTFSI| Alucone-NCM811 batteries cycled at 50 °C. (B) The associated
charge and discharge curves after 80 cycles. Performance of LMA-Alucone|LLZO/PEO/LiTFSI|Alucone-NCM811 battery: (C) specific
capacity from 0.1C to 2C, at 50 °C; (D) discharge voltage profiles from 0.1C to 2C; (E) charge/discharge voltage profiles with an areal
-2
capacity of 3.1 mAh cm .
electrode/electrolyte interfaces; second, such coating layers can optimize the contact at the interface and
improves ion diffusion. Since the capacity of the LMA|LLZO/PEO/LiTFSI|NCM811 battery is constantly
fading, reliable rate performance over stable cycles cannot be established. To be competitive with
commercial lithium-ion batteries, the LMA-Alucone|LLZO/PEO/LiTFSI|Alucone-NCM811 battery with an
areal capacity of 3.1 mAh cm (mass loading of NCM811 is ~20 mg cm ) was constructed, which
-2
-2
showcased an excellent performance with the alucone-coated LMA and NCM811 in Figure 4E. The battery
demonstrated an initial capacity of ~180 mAh/g and retained 87% of its capacity at 0.1C after 100 cycles.
Origin of the enhanced performance induced by ALD strategy
To understand the protection mechanism of the alucone coating layer, EIS was conducted to check the
interfacial resistance of the LMA|LLZO/PEO/LiTFSI|NCM811 and LMA-Alucone|LLZO/PEO/LiTFSI|
Alucone-NCM811 batteries after 50 cycles [Figure 5A]. The battery without alucone coating layers shows a
resistance of 607 Ω, whereas the resistance of the battery with coating only showed 152 Ω. This result
indicates that the interfacial resistance induced by the electrochemical degradation has been much more
severe in the LMA|LLZO/ PEO/LiTFSI|NCM811 battery compared to LMA-Alucone|LLZO/PEO/LiTFSI|
Alucone-NCM811 batteries, which is consistent with the rapid capacity fading seen in Figure 4A. The EIS
spectra were fitted with a transmission line model documented elsewhere [53,54] .