
Page 14 - Read Online
P. 14
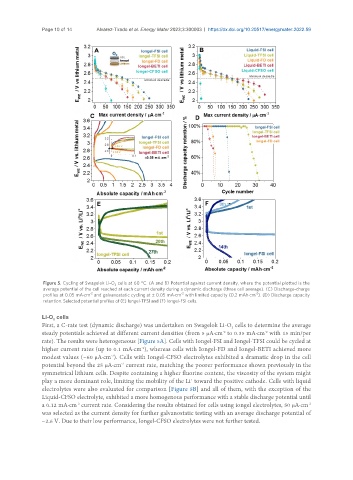
Page 10 of 14      Alvarez-Tirado et al. Energy Mater 2023;3:300003  https://dx.doi.org/10.20517/energymater.2022.59


                Figure 5. Cycling of Swagelok Li-O  cells at 60 °C. (A and B) Potential against current density, where the potential plotted is the
                                        2
                average potential of the cell reached at each current density during a dynamic discharge (three cell average). (C) Discharge-charge
                               -2
                                                              -2
                                                                                       -2
                profiles at 0.05 mA·cm  and galvanostatic cycling at ± 0.05 mA·cm  with limited capacity (0.2 mAh·cm ). (D) Discharge capacity
                retention. Selected potential profiles of (E) Iongel-TFSI and (F) Iongel-FSI cells.
               Li-O  cells
                   2
               First, a C-rate test (dynamic discharge) was undertaken on Swagelok Li-O  cells to determine the average
                                                                               2
               steady potentials achieved at different current densities (from 5 μA·cm  to 0.35 mA·cm  with 15 min/per
                                                                            -2
                                                                                          -2
               rate). The results were heterogeneous [Figure 5A]. Cells with Iongel-FSI and Iongel-TFSI could be cycled at
               higher current rates (up to 0.1 mA·cm ), whereas cells with Iongel-FD and Iongel-BETI achieved more
                                                 -2
               modest values (~60 μA·cm ). Cells with Iongel-CFSO electrolytes exhibited a dramatic drop in the cell
                                      -2
                                          -2
               potential beyond the 25 μA·cm  current rate, matching the poorer performance shown previously in the
               symmetrical lithium cells. Despite containing a higher fluorine content, the viscosity of the system might
                                                                 +
               play a more dominant role, limiting the mobility of the Li  toward the positive cathode. Cells with liquid
               electrolytes were also evaluated for comparison [Figure 5B] and all of them, with the exception of the
               Liquid-CFSO electrolyte, exhibited a more homogenous performance with a stable discharge potential until
                                                                                                         -2
               a 0.12 mA·cm  current rate. Considering the results obtained for cells using iongel electrolytes, 50 μA·cm
                           -2
               was selected as the current density for further galvanostatic testing with an average discharge potential of
               ~2.6 V. Due to their low performance, Iongel-CFSO electrolytes were not further tested.