
Page 119 - Read Online
P. 119
Page 8 of 12 Cui et al. Energy Mater 2023;3:300034 https://dx.doi.org/10.20517/energymater.2023.19
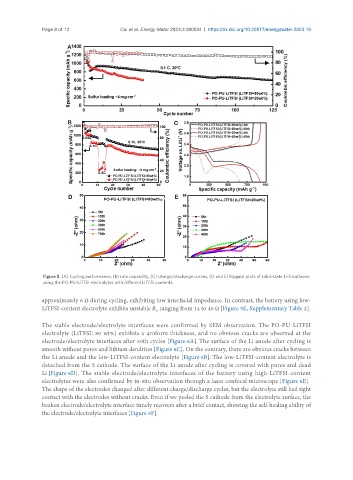
Figure 5. (A) Cycling performance, (B) rate capability, (C) charge/discharge curves, (D and E) Nyquist plots of solid-state Li-S batteries
using the PO-PU-LiTFSI electrolytes with different LiTFSI contents.
approximately 6 Ω during cycling, exhibiting low interfacial impedance. In contrast, the battery using low-
LiTFSI-content electrolyte exhibits unstable R ranging from 14 to 46 Ω [Figure 5E, Supplementary Table 2].
ct
The stable electrode/electrolyte interfaces were confirmed by SEM observation. The PO-PU-LiTFSI
electrolyte (LiTFSI: 80 wt%) exhibits a uniform thickness, and no obvious cracks are observed at the
electrode/electrolyte interfaces after 50th cycles [Figure 6A]. The surface of the Li anode after cycling is
smooth without pores and lithium dendrites [Figure 6C]. On the contrary, there are obvious cracks between
the Li anode and the low-LiTFSI-content electrolyte [Figure 6B]. The low-LiTFSI-content electrolyte is
detached from the S cathode. The surface of the Li anode after cycling is covered with pores and dead
Li [Figure 6D]. The stable electrode/electrolyte interfaces of the battery using high-LiTFSI-content
electrolytes were also confirmed by in-situ observation through a laser confocal microscope [Figure 6E].
The shape of the electrodes changed after different charge/discharge cycles, but the electrolyte still had tight
contact with the electrodes without cracks. Even if we peeled the S cathode from the electrolyte surface, the
broken electrode/electrolyte interface timely recovers after a brief contact, showing the self-healing ability of
the electrode/electrolyte interfaces [Figure 6F].