
Page 116 - Read Online
P. 116
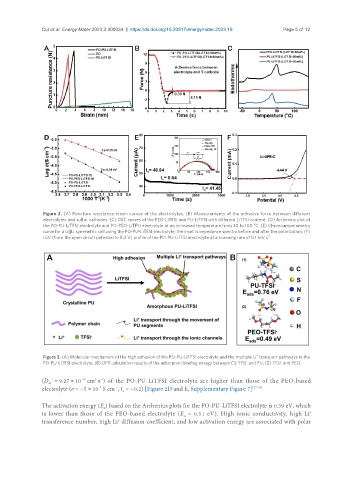
Cui et al. Energy Mater 2023;3:300034  https://dx.doi.org/10.20517/energymater.2023.19  Page 5 of 12


                Figure 2. (A) Puncture resistance-strain curves of the electrolytes. (B) Measurements of the adhesive force between different
                electrolytes and sulfur cathodes. (C) DSC curves of the PEO-LiTFSI and PU-LiTFSI with different LiTFSI content. (D) Arrhenius plot of
                                                                                       o
                the PO-PU-LiTFSI electrolyte and PO-PEO-LiTFSI electrolyte at an increased temperature from 30 to 100  C. (E) Chronoamperometry
                curve for a Li||Li symmetric cell using the PO-PU-LiTFSI electrolyte; the inset is impedance spectra before and after the polarization. (F)
                                                                                           -1
                LSV (from the open circuit potential to 5.0 V) profile of the PO-PU-LiTFSI electrolyte at a scanning rate of 0.1 mV s .


                                                                                       +
                Figure 3. (A) Molecular mechanism of the high adhesion of the PO-PU-LiTFSI electrolyte and the multiple Li  transport pathways in the
                                                                                    -           -
                PO-PU-LiTFSI electrolyte. (B) DFT calculation results of the adsorption binding energy between (1) TFSI  and PU, (2) TFSI  and PEO.
               (D  = 9.27 × 10  cm  s ) of the PO-PU-LiTFSI electrolyte are higher than those of the PEO-based
                            -10
                  +
                                 2 -1
                 Li
                                        -1
               electrolyte (σ = ~5 × 10  S cm , t  = ~0.2) [Figure 2D and E, Supplementary Figure 7] [27-29] .
                                  -5
                                          +
               The activation energy (E ) based on the Arrhenius plots for the PO-PU-LiTFSI electrolyte is 0.39 eV, which
                                    a
                                                                                                         +
               is lower than those of the PEO-based electrolyte (E  = 0.51 eV). High ionic conductivity, high Li
                                                               a
                                         +
               transference number, high Li  diffusion coefficient, and low activation energy are associated with polar