
Page 164 - Read Online
P. 164
Page 6 of 10 Liu et al. Energy Mater 2023;3:300011 https://dx.doi.org/10.20517/energymater.2022.68
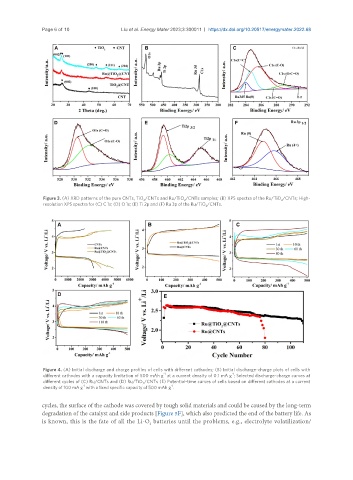
Figure 3. (A) XRD patterns of the pure CNTs, TiO /CNTs and Ru/TiO /CNTs samples; (B) XPS spectra of the Ru/TiO /CNTs; High-
2 2 2
resolution XPS spectra for (C) C 1s; (D) O 1s; (E) Ti 2p and (F) Ru 3p of the Ru/TiO /CNTs.
2
Figure 4. (A) Initial discharge and charge profiles of cells with different cathodes; (B) Initial discharge-charge plots of cells with
-1
-1
different cathodes with a capacity limitation of 500 mAh g at a current density of 0.1 mA g ; Selected discharge-charge curves at
different cycles of (C) Ru/CNTs and (D) Ru/TiO /CNTs (E) Potential-time curves of cells based on different cathodes at a current
2
-1
-1
density of 100 mA g with a fixed specific capacity of 500 mAh g .
cycles, the surface of the cathode was covered by tough solid materials and could be caused by the long-term
degradation of the catalyst and side products [Figure 5F], which also predicted the end of the battery life. As
is known, this is the fate of all the Li-O batteries until the problems, e.g., electrolyte volatilization/
2