


Page 53 - Read Online
P. 53
Geng et al. Carbon Footprints 2025, 4, 8  https://dx.doi.org/10.20517/cf.2025.02  Page 9 of 15


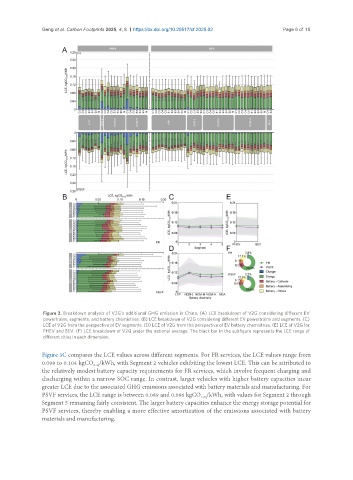
                Figure 3. Breakdown analysis of V2G’s additional GHG emission in China. (A) LCE breakdown of V2G considering different EV
                powertrains, segments, and battery chemistries. (B) LCE breakdown of V2G considering different EV powertrains and segments. (C)
                LCE of V2G from the perspective of EV segments. (D) LCE of V2G from the perspective of EV battery chemistries. (E) LCE of V2G for
                PHEV and BEV. (F) LCE breakdown of V2G under the national average. The black bar in the subfigure represents the LCE range of
                different cities in each dimension.


               Figure 3C compares the LCE values across different segments. For FR services, the LCE values range from
               0.098 to 0.104 kgCO /kWh, with Segment 2 vehicles exhibiting the lowest LCE. This can be attributed to
                                2-eq
               the relatively modest battery capacity requirements for FR services, which involve frequent charging and
               discharging within a narrow SOC range. In contrast, larger vehicles with higher battery capacities incur
               greater LCE due to the associated GHG emissions associated with battery materials and manufacturing. For
               PSVF services, the LCE range is between 0.089 and 0.096 kgCO /kWh, with values for Segment 2 through
                                                                     2-eq
               Segment 5 remaining fairly consistent. The larger battery capacities enhance the energy storage potential for
               PSVF services, thereby enabling a more effective amortization of the emissions associated with battery
               materials and manufacturing.

