


Page 52 - Read Online
P. 52
Page 8 of 15                     Geng et al. Carbon Footprints 2025, 4, 8  https://dx.doi.org/10.20517/cf.2025.02


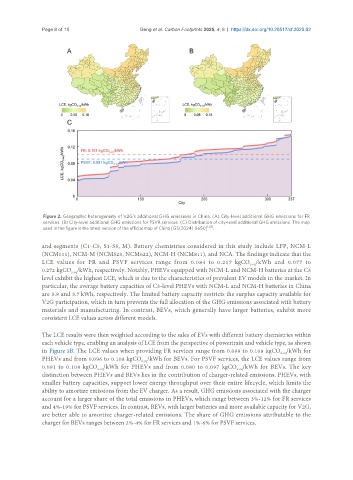
                Figure 2. Geographic heterogeneity of V2G’s additional GHG emissions in China. (A) City-level additional GHG emissions for FR
                services. (B) City-level additional GHG emissions for PSVR services. (C) Distribution of city-level additional GHG emissions. The map
                used in the figure is the latest version of the official map of China [GS(2024) 0650] [38] .

               and segments (C1-C5, S1-S5, M). Battery chemistries considered in this study include LFP, NCM-L
               (NCM111), NCM-M (NCM523, NCM622), NCM-H (NCM811), and NCA. The findings indicate that the
               LCE  values  for  FR  and  PSVF  services  range  from  0.084  to  0.217  kgCO /kWh  and  0.077  to
                                                                                     2-eq
               0.272 kgCO /kWh, respectively. Notably, PHEVs equipped with NCM-L and NCM-H batteries at the C3
                         2-eq
               level exhibit the highest LCE, which is due to the characteristics of prevalent EV models in the market. In
               particular, the average battery capacities of C3-level PHEVs with NCM-L and NCM-H batteries in China
               are 5.8 and 5.7 kWh, respectively. The limited battery capacity restricts the surplus capacity available for
               V2G participation, which in turn prevents the full allocation of the GHG emissions associated with battery
               materials and manufacturing. In contrast, BEVs, which generally have larger batteries, exhibit more
               consistent LCE values across different models.


               The LCE results were then weighted according to the sales of EVs with different battery chemistries within
               each vehicle type, enabling an analysis of LCE from the perspective of powertrain and vehicle type, as shown
               in Figure 3B. The LCE values when providing FR services range from 0.099 to 0.108 kgCO /kWh for
                                                                                                2-eq
               PHEVs and from 0.096 to 0.108 kgCO /kWh for BEVs. For PSVF services, the LCE values range from
                                                 2-eq
               0.091 to 0.108 kgCO /kWh for PHEVs and from 0.080 to 0.097 kgCO /kWh for BEVs. The key
                                  2-eq
                                                                                 2-eq
               distinction between PHEVs and BEVs lies in the contribution of charger-related emissions. PHEVs, with
               smaller battery capacities, support lower energy throughput over their entire lifecycle, which limits the
               ability to amortize emissions from the EV charger. As a result, GHG emissions associated with the charger
               account for a larger share of the total emissions in PHEVs, which range between 3%-12% for FR services
               and 4%-19% for PSVF services. In contrast, BEVs, with larger batteries and more available capacity for V2G,
               are better able to amortize charger-related emissions. The share of GHG emissions attributable to the
               charger for BEVs ranges between 2%-4% for FR services and 1%-6% for PSVF services.

