


Page 31 - Read Online
P. 31
Tong et al. Carbon Footprints 2025;4:2    https://dx.doi.org/10.20517/cf.2024.44  Page 5 of 18

               First, by isolating a single industry sector or a group of sectors as a subsystem within the broader economy,
               it examines the intricate interactions of emissions among various branch sectors within this subsystem, as
               well as the interrelations across diverse subsystems of the entire economic framework. Additionally, it
               accounts for external influences by incorporating the import/export sector, thereby enabling a systematic
               identification of key sectors that significantly impact emissions within the overall economic system .
                                                                                                  [45]
               Second, by leveraging the input-output linkages between different industry sectors, this method unveils the
               direct and indirect emissions generated by the subsystem to fulfill its own final demand. By categorizing
               various driving mechanisms, it highlights the industrial linkage effects of emissions within the subsystem.
               This detailed understanding empowers policymakers to devise more tailored and effective policies and
                                            [44]
               measures for emission reduction . Furthermore, based on the insights derived from the input-output
               subsystem analysis, the potential for GHG emission reduction will be assessed under various scenarios,
               which can offer implementation to actions for various stakeholders.


               METHODOLOGY AND DATA
               Subsystem input-output decomposition analysis
               This study adopts the input-output subsystem approach proposed by Alcántara et al.  and Liu et al. . This
                                                                                      [44]
                                                                                                   [43]
               method decomposes the total emission of a certain pollutant generated by the j-th industry sector in the
               economy, driven by final demand, into three stages, ultimately breaking it down into 12 components.

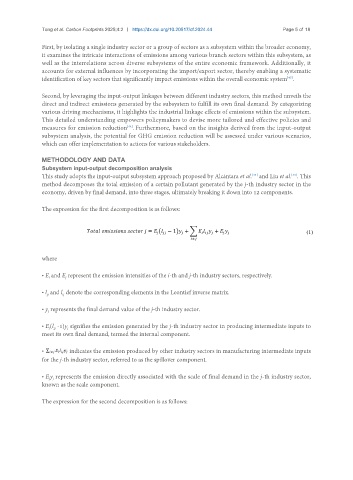
               The expression for the first decomposition is as follows:


               where

               • E and E represent the emission intensities of the i-th and j-th industry sectors, respectively.
                 i
                       j
               • l  and l  denote the corresponding elements in the Leontief inverse matrix.
                 jj
                      ij
               • y represents the final demand value of the j-th industry sector.
                 j

               • E(l  -1)y signifies the emission generated by the j-th industry sector in producing intermediate inputs to
                  j jj
                        j
               meet its own final demand, termed the internal component.
               •         indicates the emission produced by other industry sectors in manufacturing intermediate inputs
               for the j-th industry sector, referred to as the spillover component.

               • Ey represents the emission directly associated with the scale of final demand in the j-th industry sector,
                  j j
               known as the scale component.


               The expression for the second decomposition is as follows:

