


Page 27 - Read Online
P. 27
Zhen et al. Carbon Footprints 2024;3:7  https://dx.doi.org/10.20517/cf.2023.50   Page 9 of 17


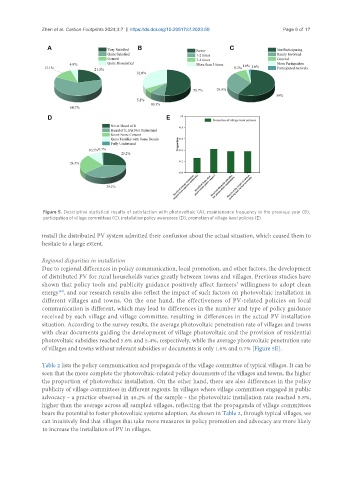
                Figure 5. Descriptive statistical results of satisfaction with photovoltaic (A), maintenance frequency in the previous year (B),
                participation of village committees (C), installation policy awareness (D), promotion of village level policies (E).

               install the distributed PV system admitted their confusion about the actual situation, which caused them to
               hesitate to a large extent.


               Regional disparities in installation
               Due to regional differences in policy communication, local promotion, and other factors, the development
               of distributed PV for rural households varies greatly between towns and villages. Previous studies have
               shown that policy tools and publicity guidance positively affect farmers’ willingness to adopt clean
                     [38]
               energy , and our research results also reflect the impact of such factors on photovoltaic installation in
               different villages and towns. On the one hand, the effectiveness of PV-related policies on local
               communication is different, which may lead to differences in the number and type of policy guidance
               received by each village and village committee, resulting in differences in the actual PV installation
               situation. According to the survey results, the average photovoltaic penetration rate of villages and towns
               with clear documents guiding the development of village photovoltaic and the provision of residential
               photovoltaic subsidies reached 5.6% and 5.4%, respectively, while the average photovoltaic penetration rate
               of villages and towns without relevant subsidies or documents is only 1.6% and 0.7% [Figure 5E].


               Table 2 lists the policy communication and propaganda of the village committee of typical villages. It can be
               seen that the more complete the photovoltaic-related policy documents of the villages and towns, the higher
               the proportion of photovoltaic installation. On the other hand, there are also differences in the policy
               publicity of village committees in different regions. In villages where village committees engaged in public
               advocacy - a practice observed in 46.2% of the sample - the photovoltaic installation rate reached 5.8%,
               higher than the average across all sampled villages, reflecting that the propaganda of village committees
               bears the potential to foster photovoltaic systems adoption. As shown in Table 2, through typical villages, we
               can intuitively find that villages that take more measures in policy promotion and advocacy are more likely
               to increase the installation of PV in villages.

