
Page 129 - Read Online
P. 129
Fang et al. Cancer Drug Resist. 2025;8:42 Page 9 of 13
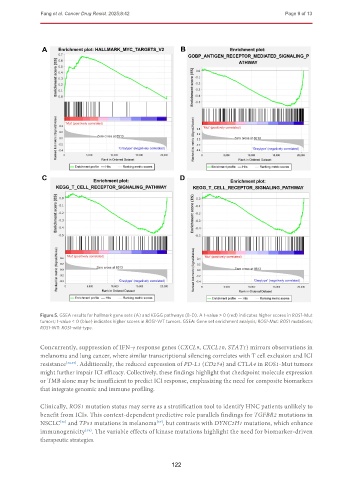
Figure 5. GSEA results for hallmark gene sets (A) and KEGG pathways (B-D). A t-value > 0 (red) indicates higher scores in ROS1-Mut
tumors; t-value < 0 (blue) indicates higher scores in ROS1-WT tumors. GSEA: Gene set enrichment analysis; ROS1-Mut: ROS1 mutations;
ROS1-WT: ROS1-wild-type.
Concurrently, suppression of IFN-γ response genes (CXCL9, CXCL10, STAT1) mirrors observations in
melanoma and lung cancer, where similar transcriptional silencing correlates with T cell exclusion and ICI
resistance [34,35] . Additionally, the reduced expression of PD-L1 (CD274) and CTLA4 in ROS1-Mut tumors
might further impair ICI efficacy. Collectively, these findings highlight that checkpoint molecule expression
or TMB alone may be insufficient to predict ICI response, emphasizing the need for composite biomarkers
that integrate genomic and immune profiling.
Clinically, ROS1 mutation status may serve as a stratification tool to identify HNC patients unlikely to
benefit from ICIs. This context-dependent predictive role parallels findings for TGFBR2 mutations in
NSCLC and TP53 mutations in melanoma , but contrasts with DYNC2H1 mutations, which enhance
[36]
[37]
immunogenicity . The variable effects of kinase mutations highlight the need for biomarker-driven
[38]
therapeutic strategies.
122