
Page 99 - Read Online
P. 99
Shi et al. Art Int Surg 2024;4:247-57 https://dx.doi.org/10.20517/ais.2024.17 Page 253
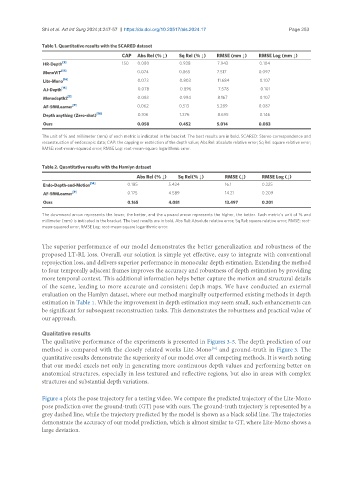
Table 1. Quantitative results with the SCARED dataset
CAP Abs Rel (% ↓) Sq Rel (% ↓) RMSE (mm ↓) RMSE Log (mm ↓)
HR-Depth [3] 150 0.080 0.938 7.943 0.104
MonoViT [17] 0.074 0.865 7.517 0.097
Lite-Mono [16] 0.073 0.803 11.684 0.107
AJ-Depth [15] 0.078 0.896 7.578 0.101
Monodepth2 [1] 0.083 0.994 8.167 0.107
AF-SfMLearner [9] 0.062 0.513 5.289 0.087
Depth anything (Zero-shot) [18] 0.106 1.376 8.695 0.146
Ours 0.058 0.452 5.014 0.083
The unit of % and millimeter (mm) of each metric is indicated in the bracket. The best results are in bold. SCARED: Stereo correspondence and
reconstruction of endoscopic data; CAP: the capping or restriction of the depth value; Abs Rel: absolute relative error; Sq Rel: square relative error;
RMSE: root-mean-squared error; RMSE Log: root-mean-square logarithmic error.
Table 2. Quantitative results with the Hamlyn dataset
Abs Rel (% ↓) Sq Rel(% ↓) RMSE (↓) RMSE Log (↓)
Endo-Depth-and-Motion [14] 0.185 5.424 16.1 0.225
AF-SfMLearner [9] 0.175 4.589 14.21 0.209
Ours 0.165 4.081 13.497 0.201
The downward arrow represents the lower, the better, and the upward arrow represents the higher, the better. Each metric’s unit of % and
millimeter (mm) is indicated in the bracket. The best results are in bold. Abs Rel: Absolute relative error; Sq Rel: square relative error; RMSE: root-
mean-squared error; RMSE Log: root-mean-square logarithmic error.
The superior performance of our model demonstrates the better generalization and robustness of the
proposed LT-RL loss. Overall, our solution is simple yet effective, easy to integrate with conventional
reprojection loss, and delivers superior performance in monocular depth estimation. Extending the method
to four temporally adjacent frames improves the accuracy and robustness of depth estimation by providing
more temporal context. This additional information helps better capture the motion and structural details
of the scene, leading to more accurate and consistent depth maps. We have conducted an external
evaluation on the Hamlyn dataset, where our method marginally outperformed existing methods in depth
estimation in Table 1. While the improvement in depth estimation may seem small, such enhancements can
be significant for subsequent reconstruction tasks. This demonstrates the robustness and practical value of
our approach.
Qualitative results
The qualitative performance of the experiments is presented in Figures 3-5. The depth prediction of our
[16]
method is compared with the closely related works Lite-Mono and ground-truth in Figure 3. The
quantitative results demonstrate the superiority of our model over all competing methods. It is worth noting
that our model excels not only in generating more continuous depth values and performing better on
anatomical structures, especially in less textured and reflective regions, but also in areas with complex
structures and substantial depth variations.
Figure 4 plots the pose trajectory for a testing video. We compare the predicted trajectory of the Lite-Mono
pose prediction over the ground-truth (GT) pose with ours. The ground-truth trajectory is represented by a
grey dashed line, while the trajectory predicted by the model is shown as a black solid line. The trajectories
demonstrate the accuracy of our model prediction, which is almost similar to GT, where Lite-Mono shows a
large deviation.