
Page 12 - Read Online
P. 12
Page 137 Bektaş et al. Art Int Surg 2022;2:132-43 https://dx.doi.org/10.20517/ais.2022.20
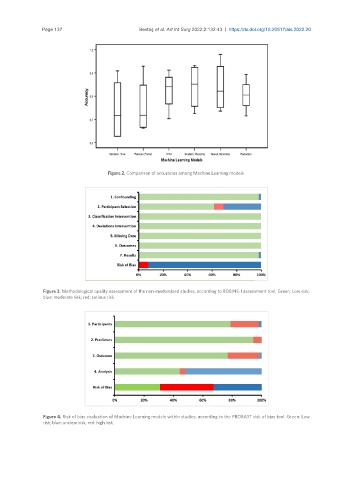
Figure 2. Comparison of accuracies among Machine Learning models.
Figure 3. Methodological quality assessment of the non-randomized studies, according to ROBINS-I assessment tool. Green: Low risk;
blue: moderate risk; red: serious risk.
Figure 4. Risk of bias evaluation of Machine Learning models within studies, according to the PROBAST risk of bias tool. Green: Low
risk; blue: unclear risk; red: high risk.