
Page 298 - Read Online
P. 298
Zhou et al. Microstructures 2023;3:2023043 https://dx.doi.org/10.20517/microstructures.2023.38 Page 15 of 23
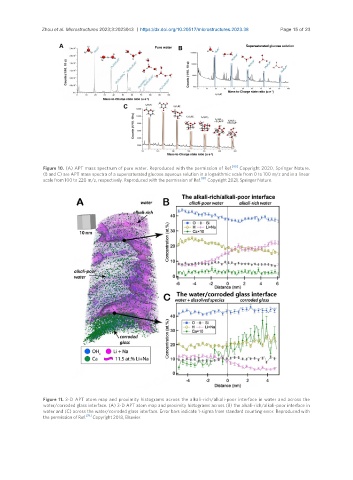
Figure 10. (A) APT mass spectrum of pure water. Reproduced with the permission of Ref. [80] Copyright 2020, Springer Nature.
(B and C) are APT mass spectra of a supersaturated glucose aqueous solution in a logarithmic scale from 0 to 100 m/z and in a linear
scale from 100 to 220 m/z, respectively. Reproduced with the permission of Ref. [81] Copyright 2021, Springer Nature.
Figure 11. 3-D APT atom map and proximity histograms across the alkali-rich/alkali-poor interface in water and across the
water/corroded glass interface. (A) 3-D APT atom map and proximity histograms across (B) the alkali-rich/alkali-poor interface in
water and (C) across the water/corroded glass interface. Error bars indicate 1-sigma from standard counting error. Reproduced with
the permission of Ref. [39] Copyright 2018, Elsevier.