
Page 297 - Read Online
P. 297
Page 14 of 23 Zhou et al. Microstructures 2023;3:2023043 https://dx.doi.org/10.20517/microstructures.2023.38
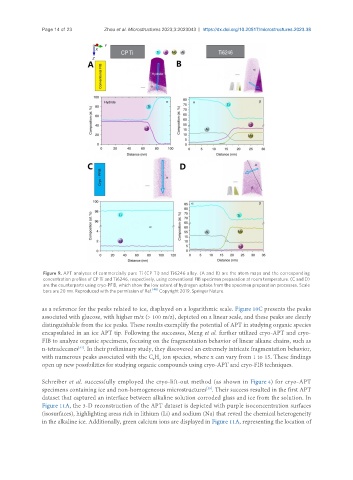
Figure 9. APT analyses of commercially pure Ti (CP Ti) and Ti6246 alloy. (A and B) are the atom maps and the corresponding
concentration profiles of CP Ti and Ti6246, respectively, using conventional FIB specimen preparation at room temperature. (C and D)
are the counterparts using cryo-PFIB, which show the low extent of hydrogen uptake from the specimen preparation processes. Scale
[46]
bars are 20 nm. Reproduced with the permission of Ref. Copyright 2019, Springer Nature.
as a reference for the peaks related to ice, displayed on a logarithmic scale. Figure 10C presents the peaks
associated with glucose, with higher m/z (> 100 m/z), depicted on a linear scale, and these peaks are clearly
distinguishable from the ice peaks. These results exemplify the potential of APT in studying organic species
encapsulated in an ice APT tip. Following the successes, Meng et al. further utilized cryo-APT and cryo-
FIB to analyze organic specimens, focusing on the fragmentation behavior of linear alkane chains, such as
n-tetradecanes . In their preliminary study, they discovered an extremely intricate fragmentation behavior,
[42]
with numerous peaks associated with the C H ion species, where x can vary from 1 to 15. These findings
y
x
open up new possibilities for studying organic compounds using cryo-APT and cryo-FIB techniques.
Schreiber et al. successfully employed the cryo-lift-out method (as shown in Figure 4) for cryo-APT
specimens containing ice and non-homogeneous microstructures . Their success resulted in the first APT
[39]
dataset that captured an interface between alkaline solution corroded glass and ice from the solution. In
Figure 11A, the 3-D reconstruction of the APT dataset is depicted with purple isoconcentration surfaces
(isosurfaces), highlighting areas rich in lithium (Li) and sodium (Na) that reveal the chemical heterogeneity
in the alkaline ice. Additionally, green calcium ions are displayed in Figure 11A, representing the location of