
Page 9 - Read Online
P. 9
Xu et al. Microstructures 2023;3:2023015 https://dx.doi.org/10.20517/microstructures.2022.40 Page 5 of 9
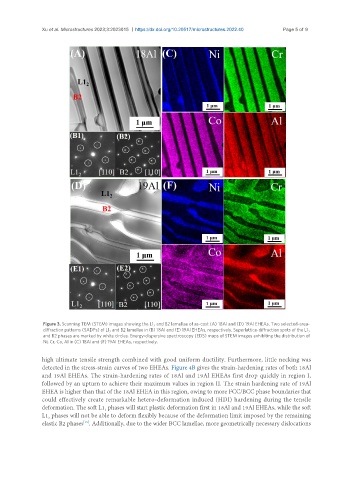
Figure 3. Scanning TEM (STEM) images showing the L1 and B2 lamellae of as-cast (A) 18Al and (D) 19Al EHEAs. Two selected-area-
2
diffraction patterns (SADPs) of L1 and B2 lamellae in (B) 18Al and (E) 19Al EHEAs, respectively. Superlattice-diffraction spots of the L1 2
2
and B2 phases are marked by white circles. Energy-dispersive spectroscopy (EDS) maps of STEM images exhibiting the distribution of
Ni, Cr, Co, Al in (C) 18Al and (F) 19Al EHEAs, respectively.
high ultimate tensile strength combined with good uniform ductility. Furthermore, little necking was
detected in the stress-strain curves of two EHEAs. Figure 4B gives the strain-hardening rates of both 18Al
and 19Al EHEAs. The strain-hardening rates of 18Al and 19Al EHEAs first drop quickly in region I,
followed by an upturn to achieve their maximum values in region II. The strain hardening rate of 19Al
EHEA is higher than that of the 18Al EHEA in this region, owing to more FCC/BCC phase boundaries that
could effectively create remarkable hetero-deformation induced (HDI) hardening during the tensile
deformation. The soft L1 phases will start plastic deformation first in 18Al and 19Al EHEAs, while the soft
2
L1 phases will not be able to deform flexibly because of the deformation limit imposed by the remaining
2
elastic B2 phases . Additionally, due to the wider BCC lamellae, more geometrically necessary dislocations
[15]