
Page 8 - Read Online
P. 8
Page 4 of 9 Xu et al. Microstructures 2023;3:2023015 https://dx.doi.org/10.20517/microstructures.2022.40
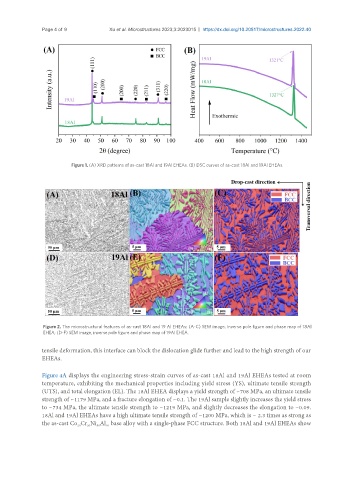
Figure 1. (A) XRD patterns of as-cast 18Al and 19Al EHEAs. (B) DSC curves of as-cast 18Al and 19Al EHEAs.
Figure 2. The microstructural features of as-cast 18Al and 19 Al EHEAs: (A-C) SEM image, inverse pole figure and phase map of 18Al
EHEA; (D-F) SEM image, inverse pole figure and phase map of 19Al EHEA.
tensile deformation, this interface can block the dislocation glide further and lead to the high strength of our
EHEAs.
Figure 4A displays the engineering stress-strain curves of as-cast 18Al and 19Al EHEAs tested at room
temperature, exhibiting the mechanical properties including yield stress (YS), ultimate tensile strength
(UTS), and total elongation (EL). The 18Al EHEA displays a yield strength of ~708 MPa, an ultimate tensile
strength of ~1179 MPa, and a fracture elongation of ~0.1. The 19Al sample slightly increases the yield stress
to ~734 MPa, the ultimate tensile strength to ~1219 MPa, and slightly decreases the elongation to ~0.09.
18Al and 19Al EHEAs have a high ultimate tensile strength of ~1200 MPa, which is ~ 2.3 times as strong as
the as-cast Co Cr Ni Al base alloy with a single-phase FCC structure. Both 18Al and 19Al EHEAs show
50
10
20
20