
Page 23 - Read Online
P. 23
Page 8 of 12 Zhang et al. Microstructures 2023;3:2023010 https://dx.doi.org/10.20517/microstructures.2022.39
Table 1. Elastic modulus of CIPS and IPS by CR-AFM
Properties Tip Si HOPG CIPS IPS
1st CRF (kHz) 653.01 ± 0.25 695.81 ± 0.11 696.15 ± 0.08
E (GPa) 160 15 27.42 ± 0.05 27.51 ± 0.04
z
v (Poisson’s ratio) 0.28 0.2 -0.044 0.107
CIPS: CuInP S ; IPS: In 4/3 2 6
P S ; CR-AFM: contact resonance atomic force microscopy; HOPG: highly oriented pyrolytic graphite.
2 6
Table 2. Elastic properties of CIPS and IPS by DFT
Properties C C C C C C C C C C C C C E
(GPa) 11 22 33 23 13 12 44 55 66 15 25 35 64 z
CIPS 99.86 101.68 28.02 -3.85 -4.71 25.49 6.99 6.71 37.56 1.93 4.10 2.55 0.91 26.57
IPS 89.07 75.74 33.27 9.72 10.03 23.12 25.96 11.67 9.90 -6.86 -13.56 3.77 -8.33 27.80
CIPS: CuInP S ; IPS: In P S .
2 6 4/3 2 6
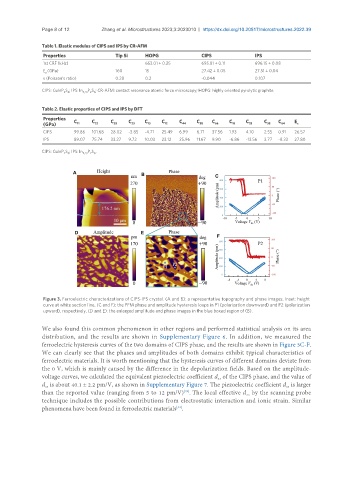
Figure 3. Ferroelectric characterizations of CIPS-IPS crystal. (A and B): a representative topography and phase images. Inset: height
curve at white section line. (C and F): the PFM phase and amplitude hysteresis loops in P1 (polarization downward) and P2 (polarization
upward), respectively. (D and E): the enlarged amplitude and phase images in the blue boxed region of (B).
We also found this common phenomenon in other regions and performed statistical analysis on its area
distribution, and the results are shown in Supplementary Figure 6. In addition, we measured the
ferroelectric hysteresis curves of the two domains of CIPS phase, and the results are shown in Figure 3C-F.
We can clearly see that the phases and amplitudes of both domains exhibit typical characteristics of
ferroelectric materials. It is worth mentioning that the hysteresis curves of different domains deviate from
the 0 V, which is mainly caused by the difference in the depolarization fields. Based on the amplitude-
voltage curves, we calculated the equivalent piezoelectric coefficient d of the CIPS phase, and the value of
33
d is about 40.1 ± 2.2 pm/V, as shown in Supplementary Figure 7. The piezoelectric coefficient d is larger
33
33
than the reported value (ranging from 5 to 12 pm/V) . The local effective d by the scanning probe
[29]
33
technique includes the possible contributions from electrostatic interaction and ionic strain. Similar
phenomena have been found in ferroelectric materials .
[44]