
Page 20 - Read Online
P. 20
Zhang et al. Microstructures 2023;3:2023010 https://dx.doi.org/10.20517/microstructures.2022.39 Page 5 of 12
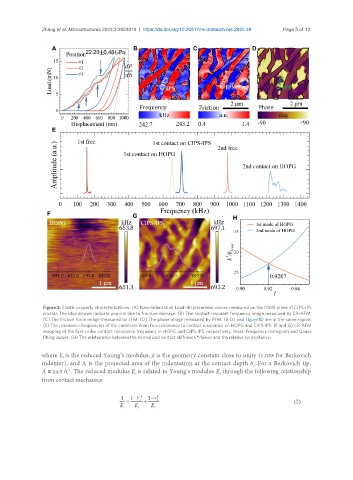
Figure 2. Elastic property characterizations. (A) Nanoindentation Load–displacement curves measured on the (001) plane of CIPS-IPS
crystal. The blue arrows indicate pop-ins due to fracture damage. (B) The contact resonant frequency image measured by CR-AFM.
(C) The friction force image measured by LFM. (D) The phase image measured by PFM. (B-D) and Figure 1D are in the same region.
(E) The resonance frequencies of the cantilever from free resonance to contact resonance on HOPG and CIPS-IPS. (F and G) CR-AFM
mapping of the first-order contact resonance frequency in HOPG and CIPS-IPS, respectively. Inset: Frequency histogram and Gauss
fitting curves. (H) The relationship between the normalized contact stiffness k*/klever and the relative tip position γ.
where E is the reduced Young’s modulus, β is the geometry constant close to unity (1.058 for Berkovich
r
indenter), and A is the projected area of the indentation at the contact depth h . For a Berkovich tip,
c
A 24.5 h . The reduced modulus E is related to Young’s modulus E through the following relationship
2
s
r
c
from contact mechanics: