
Page 282 - Read Online
P. 282
Conway et al. Vessel Plus 2020;4:25 I http://dx.doi.org/10.20517/2574-1209.2020.19 Page 7 of 11
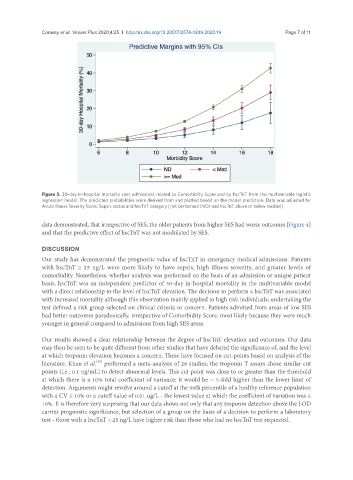
Figure 3. 30-day in-hospital mortality (per admission) related to Comorbidity Score and by hscTnT from the multivariable logistic
regression model. The predicted probabilities were derived from and plotted based on the model prediction. Data was adjusted for
Acute Illness Severity Score, Sepsis status and hscTnT category [not performed (ND) and hscTnT above or below median]
data demonstrated, that irrespective of SES, the older patients from higher SES had worse outcomes [Figure 4]
and that the predictive effect of hscTnT was not modulated by SES.
DISCUSSION
Our study has demonstrated the prognostic value of hscTnT in emergency medical admissions. Patients
with hscTnT ≥ 25 ng/L were more likely to have sepsis, high illness severity, and greater levels of
comorbidity. Nonetheless, whether analysis was performed on the basis of an admission or unique patient
basis, hscTnT was an independent predictor of 30-day in-hospital mortality in the multivariable model
with a direct relationship to the level of hscTnT elevation. The decision to perform a hscTnT was associated
with increased mortality although this observation mainly applied to high risk individuals; undertaking the
test defined a risk group selected on clinical criteria or concern. Patients admitted from areas of low SES
had better outcomes paradoxically, irrespective of Comorbidity Score, most likely because they were much
younger in general compared to admissions from high SES areas.
Our results showed a clear relationship between the degree of hscTnT elevation and outcomes. Our data
may then be seen to be quite different from other studies that have debated the significance of, and the level
at which troponin elevation becomes a concern. These have focused on cut-points based on analysis of the
[42]
literature. Khan et al. performed a meta-analysis of 28 studies; the troponin T assays chose similar cut
points (i.e., 0.1 ng/mL) to detect abnormal levels. This cut point was close to or greater than the threshold
at which there is a 10% total coefficient of variance; it would be ~ 5-fold higher than the lower limit of
detection. Arguments might revolve around a cutoff at the 99th percentile of a healthy reference population
with a CV ≤ 10% or a cutoff value of 0.01 ug/L - the lowest value at which the coefficient of variation was ≤
10%. It is therefore very surprising that our data shows not only that any troponin detection above the LOD
carries prognostic significance, but selection of a group on the basis of a decision to perform a laboratory
test - those with a hscTnT < 25 ng/L have higher risk than those who had no hscTnT test requested.