
Page 280 - Read Online
P. 280
Conway et al. Vessel Plus 2020;4:25 I http://dx.doi.org/10.20517/2574-1209.2020.19 Page 5 of 11
Table 1. Demographics of emergency admissions (2011-2018) by hscTnT status
Factor Level hscTnT - hscTnT + P-value
N 40,484 11,730
Gender Male 19,652 (48.5%) 5,836 (49.8%) 0.02
Female 20,832 (51.5%) 5,894 (50.2%)
Age, median (IQR) 61.0 (42.2, 76.4) 75.0 (60.2, 83.6) < 0.001
Length of stay (days) 4.6 (2.0, 8.7) 6.6 (3.1, 12.3) < 0.001
Outcome Alive 39,368 (97.2%) 10,788 (92.0%) < 0.001
Died 1,116 (2.8%) 942 (8.0%)
AISS 1 1,426 (4.2%) 160 (1.5%) < 0.001
2 2,868 (8.4%) 321 (3.0%)
3 4,852 (14.3%) 559 (5.2%)
4 6,302 (18.6%) 935 (8.7%)
5 7,035 (20.7%) 1,518 (14.2%)
6 11,470 (33.8%) 7,225 (67.4%)
Sepsis status 1 32,332 (79.9%) 8,591 (73.2%) < 0.001
2 7,011 (17.3%) 2,701 (23.0%)
3 1,141 (2.8%) 438 (3.7%)
Co-morbidity score < 6 23,765 (58.7%) 4,090 (34.9%) < 0.001
< 10 13,037 (32.2%) 5,121 (43.7%)
< 13 2,793 (6.9%) 1,781 (15.2%)
< 16 648 (1.6%) 485 (4.1%)
< 20 231 (0.6%) 231 (2.0%)
MDC Neuro 7,724 (18.0%) 876 (11.9%) < 0.001
Resp. 10,417 (24.3%) 2,327 (31.7%)
Cardiac 6,378 (14.9%) 1,796 (24.5%)
hscTnT: high-sensitivity cardiac troponin; AISS: acute illness severity score; LOS: length of stay; IQR: inter-quartile range; MDC: major
disease category
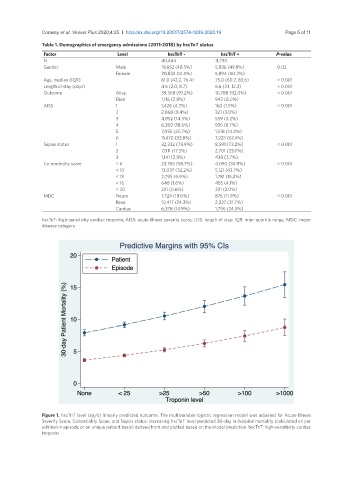
Figure 1. hscTnT level (ng/L) linearly predicted outcome. The multivariable logistic regression model was adjusted for Acute Illness
Severity Score, Comorbidity Score, and Sepsis status. Increasing hscTnT level predicted 30-day in-hospital mortality (calculated on per
admission episode or on unique patient basis) derived from and plotted based on the model prediction. hscTnT: high-sensitivity cardiac
troponin