
Page 281 - Read Online
P. 281
Page 6 of 11 Conway et al. Vessel Plus 2020;4:25 I http://dx.doi.org/10.20517/2574-1209.2020.19
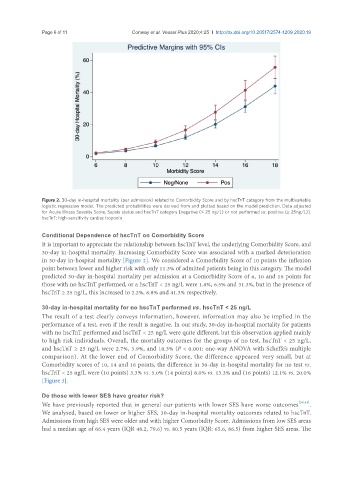
Figure 2. 30-day in-hospital mortality (per admission) related to Comorbidity Score and by hscTnT category from the multivariable
logistic regression model. The predicted probabilities were derived from and plotted based on the model prediction. Data adjusted
for Acute Illness Severity Score, Sepsis status and hscTnT category [negative (< 25 ng/L) or not performed vs. positive (≥ 25ng/L)].
hscTnT: high-sensitivity cardiac troponin
Conditional Dependence of hscTnT on Comorbidity Score
It is important to appreciate the relationship between hscTnT level, the underlying Comorbidity Score, and
30-day in-hospital mortality. Increasing Comorbidity Score was associated with a marked deterioration
in 30-day in-hospital mortality [Figure 2]. We considered a Comorbidity Score of 10 points the inflexion
point between lower and higher risk with only 11.3% of admitted patients being in this category. The model
predicted 30-day in-hospital mortality per admission at a Comorbidity Score of 6, 10 and 16 points for
those with no hscTnT performed, or a hscTnT < 25 ng/L were 1.8%, 6.5% and 31.3%, but in the presence of
hscTnT ≥ 25 ng/L, this increased to 2.2%, 8.8% and 41.3% respectively.
30-day in-hospital mortality for no hscTnT performed vs . hscTnT < 25 ng/L
The result of a test clearly conveys information, however, information may also be implied in the
performance of a test, even if the result is negative. In our study, 30-day in-hospital mortality for patients
with no hscTnT performed and hscTnT < 25 ng/L were quite different, but this observation applied mainly
to high risk individuals. Overall, the mortality outcomes for the groups of no test, hscTnT < 25 ng/L,
and hscTnT ≥ 25 ng/L were 2.7%, 3.9%, and 10.3% (P < 0.001: one-way ANOVA with Scheffe’s multiple
comparison). At the lower end of Comorbidity Score, the difference appeared very small, but at
Comorbidity scores of 10, 14 and 16 points, the difference in 30-day in-hospital mortality for no test vs.
hscTnT < 25 ng/L were (10 points) 3.3% vs. 5.0% (14 points) 8.0% vs. 13.3% and (16 points) 12.1% vs. 20.0%
[Figure 3].
Do those with lower SES have greater risk?
We have previously reported that in general our patients with lower SES have worse outcomes [39,41] .
We analysed, based on lower or higher SES, 30-day in-hospital mortality outcomes related to hscTnT.
Admissions from high SES were older and with higher Comorbidity Score. Admissions from low SES areas
had a median age of 66.4 years (IQR 48.2, 79.6) vs. 80.5 years (IQR: 65.6, 86.5) from higher SES areas. The