
Page 15 - Read Online
P. 15
Qin et al. Vessel Plus 2020;4:2 I http://dx.doi.org/10.20517/2574-1209.2019.22 Page 5 of 8
Table 2. Markers of infarct size, myocardial reperfusion, and cardiac functions
Variables Pro-UK group (n = 127) Control group (n = 185) P-value
Postoperative TIMI classification [n (%)] 0.041
0 1 (0.79%) 2 (1.08%)
1 0 (0.00%) 1 (0.54%)
2 14 (11.02%) 6 (3.24%)
3 112 (88.19%) 176 (95.14%)
CTFC (mm) 23.26 ± 2.68 24.16 + 3.65 0.047
CK peak value (U/L) 2625.50 (1548.75-4582.50) 2356.50 (1203.25-3797.00) 0.032
CK-MB peak value (U/L) 229.55 (110.60-371.33) 204.30 (96.30-329.65) 0.217
cTnI peak value (U/L) 9.53 (1.70-25.00) 7.55 (2.29-20.33) 0.511
ST-segment resolution (> 50%) [n (%)] 87 (68.50%) 139 (75.14%) 0.198
LVEDd (mm) 48.08 ± 5.73 47.43 ± 5.26 0.307
LVEF (%) 58.28 ± 9.30 58.88 ± 9.03 0.569
Ventricular aneurysm [n (%)] 14 (11.02%) 10 (5.41%) 0.067
Ventricular thrombus [n (%)] 1 (0.79%) 2 (1.12%) 0.769
CK: creatine kinase; CK-MB: creatine kinase isoenzyme-MB; LVEF: left ventricular ejection fraction; LVEDd: left ventricular end-diastolic
diameter; Pro-UK: prourokinase; TIMI: thrombolysis in myocardial infarction; CTFC: corrected TIMI frame count ; cTnI: cardiac troponin I
Table 3. Comparison of the indexes of severe bleeding events, severe arrhythmia events, and hospitalization days
Variables Pro-UK group (n = 127) Control group (n = 185) P-value
Bleeding events 0.655
No 117 (92.13%) 172 (92.97%)
Gastrointestinal bleeding 8 (6.30%) 12 (6.49%)
Cerebral hemorrhage 2 (1.57%) 1 (0.54%)
VT/VF [n (%)] 14 (11.02%) 10 (5.41%) 0.067
III° AVB [n (%)] 12 (9.45%) 7 (3.78%) 0.040
Hospitalization days (days) 10.00 (8.00-12.00) 9.00 (7.00-11.00) 0.444
VT/VF: ventricular tachycardia/ventricular fibrillation; III° AVB: third-degree atrioventricular block; Pro-UK: prourokinase
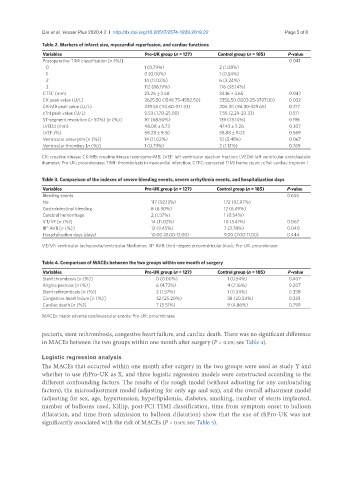
Table 4. Comparison of MACEs between the two groups within one month of surgery
Variables Pro-UK group (n = 127) Control group (n = 185) P-value
Stent thrombosis [n (%)] 0 (0.00%) 1 (0.54%) 0.407
Angina pectoris [n (%)] 6 (4.72%) 4 (2.16%) 0.207
Stent rethrombosis [n (%)] 2 (1.57%) 1 (0.54%) 0.358
Congestive heart failure [n (%)] 32 (25.20%) 38 (20.54%) 0.333
Cardiac death [n (%)] 7 (5.51%) 9 (4.86%) 0.799
MACEs: major adverse cardiovascular events; Pro-UK: prourokinase
pectoris, stent rethrombosis, congestive heart failure, and cardiac death. There was no significant difference
in MACEs between the two groups within one month after surgery (P > 0.05; see Table 4).
Logistic regression analysis
The MACEs that occurred within one month after surgery in the two groups were used as study Y and
whether to use rhPro-UK as X, and three logistic regression models were constructed according to the
different confounding factors. The results of the rough model (without adjusting for any confounding
factors), the microadjustment model (adjusting for only age and sex), and the overall adjustment model
(adjusting for sex, age, hypertension, hyperlipidemia, diabetes, smoking, number of stents implanted,
number of balloons used, Killip, post-PCI TIMI classification, time from symptom onset to balloon
dilatation, and time from admission to balloon dilatation) show that the use of rhPro-UK was not
significantly associated with the risk of MACEs (P > 0.05; see Table 5).