
Page 154 - Read Online
P. 154
Sobenin et al. Vessel Plus 2019;3:15 I http://dx.doi.org/10.20517/2574-1209.2019.09 Page 5 of 9
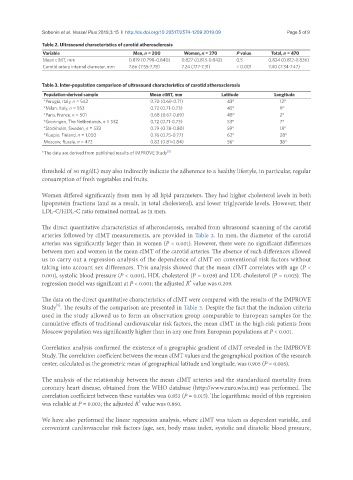
Table 2. Ultrasound characteristics of carotid atherosclerosis
Variable Men, n = 200 Women, n = 270 P value Total, n = 470
Mean cIMT, mm 0.819 (0.798-0.840) 0.827 (0.813-0.842) 0.5 0.824 (0.812-0.836)
Carotid artery internal diameter, mm 7.66 (7.55-7.78) 7.24 (7.17-7.31) < 0.001 7.40 (7.34-7.47)
Table 3. Inter-population comparison of ultrasound characteristics of carotid atherosclerosis
Population-derived sample Mean cIMT, mm Latitude Longitude
*Perugia, Italy, n = 542 0.70 (0.69-0.71) 43° 12°
*Milan, Italy, n = 553 0.72 (0.71-0.73) 45° 9°
*Paris, France, n = 501 0.68 (0.67-0.69) 48° 2°
*Groningen, The Netherlands, n = 532 0.72 (0.71-0.73) 53° 7°
*Stockholm, Sweden, n = 533 0.79 (0.78-0.80) 59° 18°
*Kuopio, Finland, n = 1,050 0.76 (0.75-0.77) 62° 28°
Moscow, Russia, n = 472 0.82 (0.81-0.84) 56° 38°
*The data are derived from published results of IMPROVE Study [5]
threshold of 50 mg/dL) may also indirectly indicate the adherence to a healthy lifestyle, in particular, regular
consumption of fresh vegetables and fruits.
Women differed significantly from men by all lipid parameters. They had higher cholesterol levels in both
lipoprotein fractions (and as a result, in total cholesterol), and lower triglyceride levels. However, their
LDL-C/HDL-C ratio remained normal, as in men.
The direct quantitative characteristics of atherosclerosis, resulted from ultrasound scanning of the carotid
arteries followed by cIMT measurements, are provided in Table 2. In men, the diameter of the carotid
arteries was significantly larger than in women (P < 0.001). However, there were no significant differences
between men and women in the mean cIMT of the carotid arteries. The absence of such differences allowed
us to carry out a regression analysis of the dependence of cIMT on conventional risk factors without
taking into account sex differences. This analysis showed that the mean cIMT correlates with age (P <
0.001), systolic blood pressure (P < 0.001), HDL cholesterol (P = 0.039) and LDL cholesterol (P = 0.003). The
2
regression model was significant at P < 0.001; the adjusted R value was 0.209.
The data on the direct quantitative characteristics of cIMT were compared with the results of the IMPROVE
[5]
Study . The results of the comparison are presented in Table 3. Despite the fact that the inclusion criteria
used in the study allowed us to form an observation group comparable to European samples for the
cumulative effects of traditional cardiovascular risk factors, the mean cIMT in the high-risk patients from
Moscow population was significantly higher than in any one from European populations at P < 0.001.
Correlation analysis confirmed the existence of a geographic gradient of cIMT revealed in the IMPROVE
Study. The correlation coefficient between the mean cIMT values and the geographical position of the research
center, calculated as the geometric mean of geographical latitude and longitude, was 0.905 (P = 0.005).
The analysis of the relationship between the mean cIMT arteries and the standardized mortality from
coronary heart disease, obtained from the WHO database (http://www.euro.who.int) was performed. The
correlation coefficient between these variables was 0.853 (P = 0.015). The logarithmic model of this regression
2
was reliable at P = 0.003; the adjusted R value was 0.860.
We have also performed the linear regression analysis, where cIMT was taken as dependent variable, and
convenient cardiovascular risk factors (age, sex, body mass index, systolic and diastolic blood pressure,