
Page 223 - Read Online
P. 223
Jagpal et al. Vessel Plus 2018;2:24 I http://dx.doi.org/10.20517/2574-1209.2018.27 Page 7 of 14
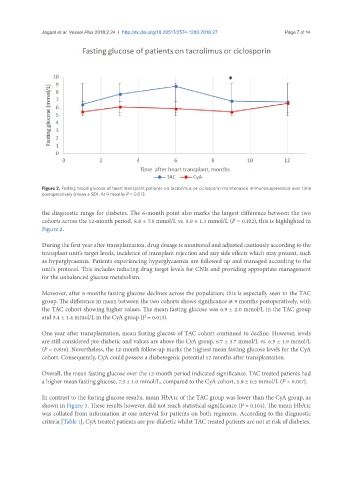
Figure 2. Fasting blood glucose of heart transplant patients on tacrolimus or ciclosporin maintenance immunosuppression over time
postoperatively (mean ± SD). At 9 months P = 0.013
the diagnostic range for diabetes. The 6-month point also marks the largest difference between the two
cohorts across the 12-month period, 8.8 ± 7.5 mmol/L vs. 5.9 ± 1.3 mmol/L (P = 0.102), this is highlighted in
Figure 2.
During the first year after transplantation, drug dosage is monitored and adjusted cautiously according to the
transplant unit’s target levels, incidence of transplant rejection and any side effects which may present, such
as hyperglycaemia. Patients experiencing hyperglycaemia are followed up and managed according to the
unit’s protocol. This includes reducing drug target levels for CNIs and providing appropriate management
for the unbalanced glucose metabolism.
Moreover, after 6-months fasting glucose declines across the population; this is especially seen in the TAC
group. The difference in mean between the two cohorts shows significance at 9 months postoperatively, with
the TAC cohort showing higher values. The mean fasting glucose was 6.9 ± 2.0 mmol/L in the TAC group
and 5.4 ± 1.4 mmol/L in the CyA group (P = 0.013).
One year after transplantation, mean fasting glucose of TAC cohort continued to decline. However, levels
are still considered pre-diabetic and values are above the CyA group, 6.7 ± 3.7 mmol/L vs. 6.5 ± 1.9 mmol/L
(P = 0.836). Nevertheless, the 12-month follow-up marks the highest mean fasting glucose levels for the CyA
cohort. Consequently, CyA could possess a diabetogenic potential 12 months after transplantation.
Overall, the mean fasting glucose over the 12-month period indicated significance. TAC treated patients had
a higher mean fasting glucose, 7.3 ± 1.0 mmol/L, compared to the CyA cohort, 5.9 ± 0.5 mmol/L (P = 0.017).
In contrast to the fasting glucose results, mean HbA1c of the TAC group was lower than the CyA group, as
shown in Figure 3. These results however, did not reach statistical significance (P = 0.104). The mean HbA1c
was collated from information at one interval for patients on both regimens. According to the diagnostic
criteria [Table 1], CyA treated patients are pre-diabetic whilst TAC treated patients are not at risk of diabetes.