
Page 222 - Read Online
P. 222
Page 6 of 14 Jagpal et al. Vessel Plus 2018;2:24 I http://dx.doi.org/10.20517/2574-1209.2018.27
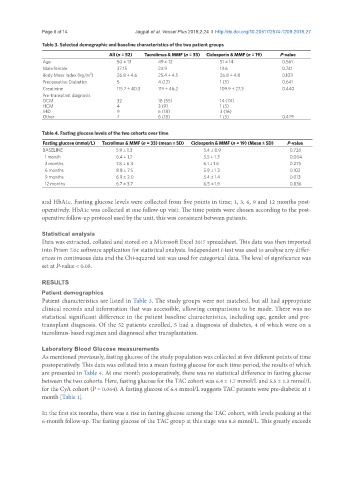
Table 3. Selected demographic and baseline characteristics of the two patient groups
All (n = 52) Tacrolimus & MMF (n = 33) Ciclosporin & MMF (n = 19) P-value
Age 50 ± 13 49 ± 12 51 ± 14 0.561
Male:female 37:15 24:9 13:6 0.741
2
Body Mass Index (kg/m ) 26.8 ± 4.6 25.4 ± 4.5 26.8 ± 4.8 0.103
Preoperative Diabetics 5 4 (12) 1 (5) 0.641
Creatinine 115.7 ± 40.3 119 ± 46.2 109.9 ± 27.3 0.440
Pre-transplant diagnosis
DCM 32 18 (55) 14 (74)
HCM 4 3 (9) 1 (5)
IHD 9 6 (18) 3 (16)
Other 7 6 (18) 1 (5) 0.479
Table 4. Fasting glucose levels of the two cohorts over time
Fasting glucose (mmol/L) Tacrolimus & MMF (n = 33) (mean ± SD) Ciclosporin & MMF (n = 19) (Mean ± SD) P-value
BASELINE 5.9 ± 1.3 5.4 ± 0.9 0.726
1 month 6.4 ± 1.7 5.5 ± 1.3 0.064
3 months 7.8 ± 6.3 6.1 ± 1.6 0.275
6 months 8.8 ± 7.5 5.9 ± 1.3 0.102
9 months 6.9 ± 2.0 5.4 ± 1.4 0.013
12 months 6.7 ± 3.7 6.5 ± 1.9 0.836
and HbA1c. Fasting glucose levels were collected from five points in time; 1, 3, 6, 9 and 12 months post-
operatively. HbA1c was collected at one follow-up visit. The time points were chosen according to the post-
operative follow-up protocol used by the unit, this was consistent between patients.
Statistical analysis
Data was extracted, collated and stored on a Microsoft Excel 2017 spreadsheet. This data was then imported
into Prism 7.0c software application for statistical analysis. Independent t-test was used to analyse any differ-
ences in continuous data and the Chi-squared test was used for categorical data. The level of significance was
set at P-value < 0.05.
RESULTS
Patient demographics
Patient characteristics are listed in Table 3. The study groups were not matched, but all had appropriate
clinical records and information that was accessible, allowing comparisons to be made. There was no
statistical significant difference in the patient baseline characteristics, including age, gender and pre-
transplant diagnosis. Of the 52 patients enrolled, 5 had a diagnosis of diabetes, 4 of which were on a
tacrolimus-based regimen and diagnosed after transplantation.
Laboratory Blood Glucose measurements
As mentioned previously, fasting glucose of the study population was collected at five different points of time
postoperatively. This data was collated into a mean fasting glucose for each time-period, the results of which
are presented in Table 4. At one month postoperatively, there was no statistical difference in fasting glucose
between the two cohorts. Here, fasting glucose for the TAC cohort was 6.4 ± 1.7 mmol/L and 5.5 ± 1.3 mmol/L
for the CyA cohort (P = 0.064). A fasting glucose of 6.4 mmol/L suggests TAC patients were pre-diabetic at 1
month [Table 1].
In the first six months, there was a rise in fasting glucose among the TAC cohort, with levels peaking at the
6-month follow-up. The fasting glucose of the TAC group at this stage was 8.8 mmol/L. This greatly exceeds