
Page 77 - Read Online
P. 77
Cordero et al. Bioresorbable scaffolds in acute coronary syndrome
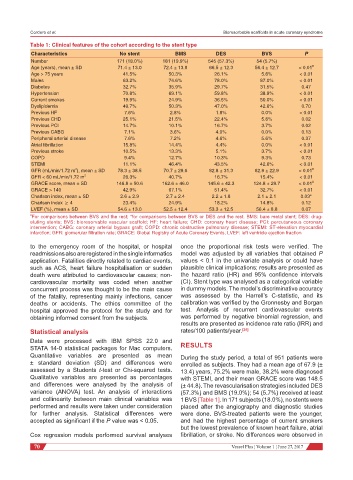
Table 1: Clinical features of the cohort according to the stent type
Characteristics No stent BMS DES BVS P
Number 171 (18.0%) 181 (19.9%) 545 (57.3%) 54 (5.7%)
Age (years), mean ± SD 71.4 ± 13.0 72.4 ± 13.8 66.5 ± 12.3 56.4 ± 12.7 < 0.01 #
Age > 75 years 41.5% 50.3% 26.1% 5.6% < 0.01
Males 63.2% 74.6% 78.0% 87.0% < 0.01
Diabetes 32.7% 35.9% 29.7% 31.5% 0.47
Hypertension 70.8% 69.1% 59.8% 38.9% < 0.01
Current smokes 19.9% 24.9% 36.5% 50.0% < 0.01
Dyslipidemia 49.7% 50.3% 47.0% 42.6% 0.70
Previous HF 7.6% 2.8% 1.8% 0.0% < 0.01
Previous CHD 25.1% 21.5% 22.4% 5.6% 0.02
Previous PCI 14.7% 10.1% 16.7% 3.7% 0.02
Previous CABG 7.1% 3.6% 4.0% 0.0% 0.13
Peripheral arterial disease 7.6% 7.2% 4.6% 5.6% 0.37
Atrial fibrillation 15.8% 14.4% 4.4% 0.0% < 0.01
Previous stroke 10.5% 13.3% 5.1% 3.7% < 0.01
COPD 9.4% 12.7% 10.3% 9.3% 0.73
STEMI 11.1% 46.4% 43.5% 42.6% < 0.01
2
GFR (mL/min/1.72 m ), mean ± SD 78.3 ± 38.5 70.7 ± 29.6 82.8 ± 31.3 82.9 ± 22.9 < 0.01 #
GFR < 60 mL/min/1.72 m 2 26.3% 40.7% 16.7% 15.4% < 0.01
GRACE score, mean ± SD 146.8 ± 50.6 162.6 ± 46.0 145.6 ± 42.3 124.8 ± 29.7 < 0.01 #
GRACE > 140 42.9% 67.1% 51.4% 32.7% < 0.01
Charlson index, mean ± SD 2.6 ± 2.9 2.7 ± 2.4 2.2 ± 1.8 2.1 ± 2.1 0.03*
Charlson index ≥ 4 23.4% 24.9% 18.2% 14.8% 0.12
LVEF (%), mean ± SD 54.6 ± 13.0 52.5 ± 12.4 53.3 ± 12.5 56.4 ± 8.8 0.07
# For comparisons between BVS and the rest; *for comparisons between BVS or DES and the rest. BMS: bare metal stent; DES: drug-
eluting stents; BVS: bioresorvable vascular scaffold; HF: heart failure; CHD: coronary heart disease; PCI: percutaneous coronary
intervention; CABG: coronary arterial bypass graft; COPD: chronic obstructive pulmonary disease; STEMI: ST-elevation myocardial
infarction; GFR: glomerular filtration rate; GRACE: Global Registry of Acute Coronary Events; LVEF: left ventricle ejection fraction
to the emergency room of the hospital, or hospital once the proportional risk tests were verified. The
readmissions also are registered in the single informatics model was adjusted by all variables that obtained P
application. Fatalities directly related to cardiac events, values < 0.1 in the univariate analysis or could have
such as ACS, heart failure hospitalisation or sudden plausible clinical implications; results are presented as
death were attributed to cardiovascular causes; non- the hazard ratio (HR) and 95% confidence intervals
cardiovascular mortality was coded when another (CI). Stent type was analysed as a categorical variable
concurrent process was thought to be the main cause in dummy models. The model’s discriminative accuracy
of the fatality, representing mainly infections, cancer was assessed by the Harrell’s C-statistic, and its
deaths or accidents. The ethics committee of the calibration was verified by the Gronnesby and Borgan
hospital approved the protocol for the study and for test. Analysis of recurrent cardiovascular events
obtaining informed consent from the subjects. was performed by negative binomial regression, and
results are presented as incidence rate ratio (IRR) and
Statistical analysis rates/100 patients/year. [24]
Data were processed with IBM SPSS 22.0 and
STATA 14-0 statistical packages for Mac computers. RESULTS
Quantitative variables are presented as mean During the study period, a total of 951 patients were
± standard deviation (SD) and differences were enrolled as subjects. They had a mean age of 67.9 (±
assessed by a Students t-test or Chi-squared tests. 13.4) years, 75.2% were male, 38.2% were diagnosed
Qualitative variables are presented as percentages with STEMI, and their mean GRACE score was 148.5
and differences were analysed by the analysis of (± 44.8). The revascularisation strategies included DES
variance (ANOVA) test. An analysis of interactions (57.3%) and BMS (19.0%); 54 (5.7%) received at least
and collinearity between main clinical variables was 1 BVS [Table 1]. In 171 subjects (18.0%), no stents were
performed and results were taken under consideration placed after the angiography and diagnostic studies
for further analysis. Statistical differences were were done. BVS-treated patients were the younger,
accepted as significant if the P value was < 0.05. and had the highest percentage of current smokers
but the lowest prevalence of known heart failure, atrial
Cox regression models performed survival analyses fibrillation, or stroke. No differences were observed in
70 Vessel Plus ¦ Volume 1 ¦ June 27, 2017