Page 108 - Read Online
P. 108

Samaha et al.                                                                                                                                                                                       Hyperlipidemia in Lebanon

           interval of 95% (q = 0.3693, q = 5.991, α = 0.05).  differences.
                                       2
                           2
                                       α
                            c
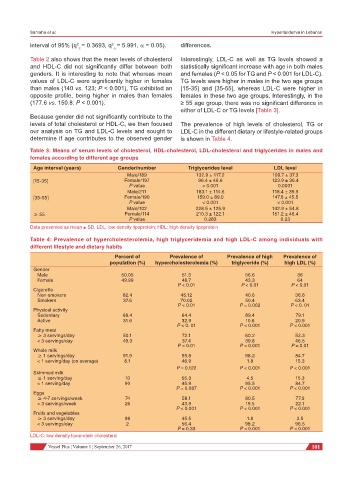
           Table 2 also shows that the mean levels of cholesterol   Interestingly, LDL-C as well as  TG  levels showed  a
           and  HDL-C  did  not  significantly  differ  between  both   statistically significant increase with age in both males
           genders.  It is interesting  to note that whereas  mean   and females (P < 0.05 for TG and P < 0.001 for LDL-C).
           values of LDL-C were significantly higher in females   TG levels were higher in males in the two age groups
           than males (140 vs. 123; P < 0.001), TG exhibited an   [15-35] and [35-55], whereas LDL-C were higher in
           opposite  profile,  being  higher  in  males  than  females   females in these two age groups. Interestingly, in the
           (177.6 vs. 150.8; P < 0.001).                      ≥ 55 age group, there was no significant difference in
                                                              either of LDL-C or TG levels [Table 3].
           Because gender did not significantly contribute to the
           levels of total cholesterol or HDL-C, we then focused   The prevalence  of high  levels of cholesterol,  TG or
           our analysis on TG and LDL-C levels and sought to   LDL-C in the different dietary or lifestyle-related groups
           determine if age contributes to the observed gender   is shown in Table 4.

           Table 3: Means of serum levels of cholesterol, HDL-cholesterol, LDL-cholesterol and triglycerides in males and
           females according to different age groups

            Age interval (years)         Gender/number          Triglycerides level          LDL level
                                            Male/189               132.9 ± 117.2             109.7 ± 37.3
            [15-35]                        Female/197               96.4 ± 48.6              123.9 ± 36.4
                                             P value                 < 0.001                   0.0001
                                            Male/211               183.1 ± 114.6             118.4 ± 39.5
            [35-55]                        Female/190               159.0 ± 89.0             147.6 ± 45.5
                                             P value                 < 0.001                   < 0.001
                                            Male/102               228.5 ± 125.9             142.9 ± 54.8
            ≥ 55                           Female/114              210.3 ± 122.1             151.2 ± 46.4
                                             P value                  0.283                     0.23
           Data presented as mean ± SD. LDL: low density lipoprotein; HDL: high density lipoprotein

           Table 4: Prevalence of hypercholesterolemia, high triglyceridemia and high LDL-C among individuals with
           different lifestyle and dietary habits
                                        Percent of        Prevalence of       Prevalence of high   Prevalence of
                                      population (%)  hypercholesterolemia (%)  triglyceride (%)  high LDL (%)
            Gender
               Male                       50.05               51.3                  56.6             36
               Female                     49.99               48.7                  43.3             64
                                                             P < 0.01             P < 0.01         P < 0.01
            Cigarette
               Non-smokers                62.4                45.12                 40.6             36.6
               Smokers                     37.6               70.02                 50.4             63.4
                                                             P < 0.01             P = 0.002        P < 0. 01
            Physical activity
               Sedentary                  68.4                64.4                  89.4             79.1
               Active                      31.6               32.9                  10.6             20.9
                                                             P < 0. 01            P < 0.001        P < 0.001
            Fatty meat
               ≥ 3 servings/day            50.1               72.1                  60.2             53.3
               < 3 servings/day           49.3                37.4                  39.8             46.5
                                                             P < 0.01             P < 0.001        P = 0.01
            Whole milk
               ≥ 1 servings/day            91.9               55.8                  98.2             84.7
               < 1 serving/day (on average)  8.1              46.9                  1.8              15.3
                                                             P = 0.122            P < 0.001        P < 0.001
            Skimmed milk
               ≥ 1 serving/day             10                 55.3                  4.5              15.3
               < 1 serving/day             90                 45.9                  95.5             84.7
                                                            P = 0.087             P < 0.001        P < 0.001
            Eggs
               ≥ 4-7 servings/week         74                 58.1                  80.5             77.9
               < 3 servings/week           26                 43.9                  19.5             22.1
                                                            P < 0.001             P < 0.001        P < 0.001
            Fruits and vegetables
               ≥ 3 servings/day            98                 45.5                  1.8              3.5
               < 3 servings/day             2                 56.4                  98.2             96.5
                                                             P = 0.33             P < 0.001        P < 0.001
           LDL-C: low density lipoprotein cholesterol
                          Vessel Plus ¦ Volume 1 ¦ September 26, 2017                                     101
   103   104   105   106   107   108   109   110   111   112   113