
Page 107 - Read Online
P. 107
Samaha et al. Hyperlipidemia in Lebanon
and analyzing were approved by the Research Ethics ranged from 142 cm to 195 cm, with a mean height of
Committee at the Lebanese University. 166.46 (± 7.76; SD) cm. Both the height and weight
of males were significantly higher than the females’
Blood sampling and laboratory [Table 1]. The range of the BMI was 14.2 to 49 kg/m ,
2
Selected participants were asked to undergo a with a mean of 26.703 ± 4.42 kg/m . Age-adjusted BMI
2
12-h-fasting period, after which 5 mm of blood were was found to be significantly higher in females than
collected by clean venipuncture into dry tubes (BD males (P < 0.05).
Vacutainer ). Plasma was separated by centrifugation
®
(1,000 g, 4 ℃, 20 min). Plasma samples were frozen In this population, the means for serum levels of
until analysis, which was carried out not later than 4 h cholesterol, LDL-C, HDL-C and triglycerides were
after phlebotomy. Since seasonal variation in plasma respectively 208.5 ± 49.5, 133.2 ± 46.1, 43.1 ± 8.9,
cholesterol levels is well documented, all blood and 163.6 ± 111.6 mg/dL [Table 2]. Overall, an
[21]
samples were collected in the same month. Plasma alarming 53.24% of the population had a cholesterol
lipids concentrations were measured at the Clinical levels above 200 mg/dL, and thus can be considered
Biochemistry Laboratory of Rayak Hospital, Lebanon. hypercholesterolemic. [22]
Total cholesterol, LDL and triglycerides levels were
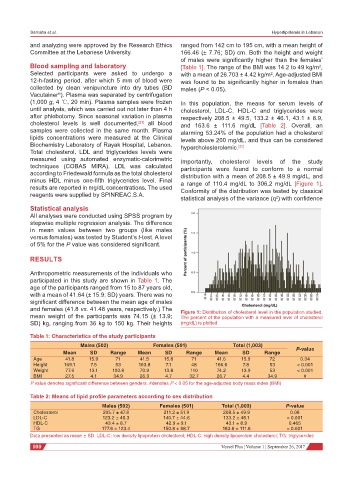
measured using automated enzymatic-calorimetric Importantly, cholesterol levels of the study
techniques (COBAS MIRA). LDL was calculated participants were found to conform to a normal
according to Friedewald formula as the total cholesterol distribution with a mean of 208.5 ± 49.9 mg/dL, and
minus HDL minus one-fifth triglycerides level. Final a range of 110.4 mg/dL to 306.2 mg/dL [Figure 1].
results are reported in mg/dL concentrations. The used Conformity of the distribution was tested by classical
reagents were supplied by SPINREAC.S.A.
statistical analysis of the variance (q ) with confidence
2
Statistical analysis
All analyses were conducted using SPSS program by
stepwise multiple regression analysis. The difference
in mean values between two groups (like males
versus females) was tested by Student’s t-test. A level
of 5% for the P value was considered significant.
RESULTS
Anthropometric measurements of the individuals who
participated in this study are shown in Table 1. The
age of the participants ranged from 15 to 87 years old,
with a mean of 41.64 (± 15.9; SD) years. There was no
significant difference between the mean age of males
and females (41.8 vs. 41.48 years, respectively.) The Figure 1: Distribution of cholesterol level in the population studied.
mean weight of the participants was 74.15 (± 13.9; The percent of the population with a measured level of cholesterol
SD) kg, ranging from 36 kg to 150 kg. Their heights (mg/dL) is plotted
Table 1: Characteristics of the study participants
Males (502) Females (501) Total (1,003)
Mean SD Range Mean SD Range Mean SD Range P-value
Age 41.8 15.9 71 41.5 15.8 71 41.6 15.9 72 0.34
Height 169.1 7.5 53 163.8 7.1 48 166.6 7.8 53 < 0.001
Weight 77.6 13.1 100.8 70.9 13.8 110 74.2 13.9 53 < 0.001
BMI 27.5 4.1 34.9 26.3 4.7 32.7 26.7 4.4 34.9 #
P value denotes significant difference between genders. #denotes P < 0.05 for the age-adjusted body mass index (BMI)
Table 2: Means of lipid profile parameters according to sex distribution
Males (502) Females (501) Total (1,003) P-value
Cholesterol 205.7 ± 47.8 211.2 ± 51.9 208.5 ± 49.9 0.08
LDL-C 123.2 ± 46.3 140.7 ± 44.6 133.2 ± 46.1 < 0.001
HDL-C 43.4 ± 8.7 42.9 ± 9.1 43.1 ± 8.9 0.465
TG 177.6 ± 123.4 150.8 ± 98.7 163.6 ± 111.6 < 0.001
Data presented as mean ± SD. LDL-C: low density lipoprotein cholesterol; HDL-C: high density lipoprotein cholesterol; TG: triglycerides
100 Vessel Plus ¦ Volume 1 ¦ September 26, 2017